In need a chart that has a shaded area between a max and min set of curves, indicating the allowable area
Like this one: https://demos.telerik.com/kendo-ui/range-area-charts/index
Hello Christian,
I understand that the suggested alternative solution using the Kendo widget may not be the perfect choice, but currently, it is the only option I can think of.
Regarding the specific time frame for the release of this feature - currently, it is marked as "Unplanned." This means that we haven't assigned a definite time frame for its implementation yet, and it is not currently part of our roadmap. Once we prioritize this task and move it to the short-term backlog, the status will be updated to "Planned," and we will likely assign it a release number.
However, considering the significance of this functionality to you, I have a suggestion that may be helpful. You can take advantage of our Feature Acceleration Program, which is designed to expedite the delivery of requested features. It's important to note that this program is not included in your regular product or support license and would involve an additional cost.
Regards,
Yanislav
Progress Telerik
Hi Yanislav,
thanks for the answer - but I'm afraid the Kendo Chart Widget is not suitable for us - as we already display multiple series in our chart - and we just want to add the RangeArea series. So we would have to completely move our existing implementation to the Kendo Chart Widget - migrating to a different vendor is much easier in that case (also because this kind of integration seems very "hacky" - even Telerik states "Note that such an integration is not supported by Telerik" and it also seems error-prone regarding updates, DOM cleanup, etc).
Best Regards,
Christian
Hello Christian,
Although we do not have a policy to commit to a specific time frame, I understand that you need a solution in the meantime.
As a temporary solution, I recommend using the Kendo Chart Widget. Here is a link to a demo that shows how you can include a Kendo Widget in Blazor Application:
https://github.com/telerik/blazor-ui/tree/master/common/kendo-in-blazor
If you have any questions about using the widget or need further assistance, please do not hesitate to reach out to us.
Thank you for your patience and understanding.
Regards,
Yanislav
Progress Telerik
Hi,
are there any plans to ever implement this? It's nice to have fancy chart types like radar line or radar columns, but I think this one should be a "basic type" of every chart component. I was hoping this type would be shipped with the "major chart enhancements" announced a few releases ago, but unfortunately it still isn't available.
I know this ticket has not that much votes, but, for example, I don't think there was even a ticket for the radar chart types (at least I didn't find them).
Please don't just paste your standard answer ".. the best way to know when a feature gets implemented, is to follow this ticket...", I would just need a very rough time frame when this will be available (if ever) - because this is crucial for us, and otherwise we should start migrating our chart to the component of another vendor before we run out of time.
Just to make sure: I'm talking about the Range-area-chart of the thread-creator (Christopher), not about the range-bar-chart from Christian (who is a different Christian)).
Thank You and Best Regards,
Christian
we need to build a chart similar to this:
https://demos.telerik.com/aspnet-ajax/htmlchart/examples/charttypes/range-bar-chart/defaultcs.aspx
hope you can provide it for blazor
Hi,
I would also need this chart type as soon as possible as we are migrating an existing (productive) application to Blazor and a range area chart is crucial for this.
I tried to achieve the same results by using the "ChartSeriesType.Area", but this doesn't work - as the "color" always starts at the x-axis and ChartSeries parameters like "LowField" don't have any impact.
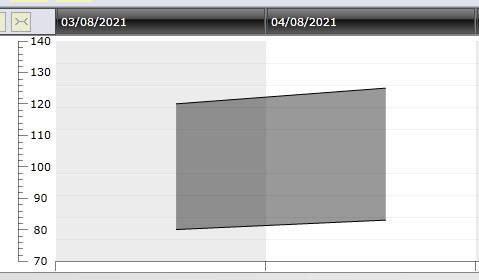
Just to make sure: this feature request would then represent something like the "RangeSeriesDefinition" of your Silverlight suite, right? For example, blood pressure display (systolic/diastolic value):
Thank You and Best Regards,
Christian
- All
- Completed (1443)
- Declined (372)
- Duplicated (410)
- In Development (7)
- Need More Info (25)
- Pending Review (1)
- Planned (10)
- Under Review (2)
- Unplanned (1104)
- Won't Fix (23)
- All
- UI for Blazor
- Agentic UI Generator
- AIPrompt
- AnimationContainer
- AppBar
- ArcGauge
- AutoComplete
- Avatar
- Badge
- Barcode
- Breadcrumb
- BrowserExtension
- Button
- ButtonGroup
- Calendar
- Card
- Carousel
- Charts
- Chat
- Checkbox
- Chip
- ChipList
- ChunkProgressBar
- CircularGauge
- ColorGradient
- ColorPalette
- ColorPicker
- ComboBox
- ContextMenu
- DateInput
- DatePicker
- DateRangePicker
- DateTimePicker
- Diagram
- Dialog
- DockManager
- Drawer
- DropDownButton
- DropDownList
- DropDownTree
- DropZone
- Editor
- FileManager
- FileSelect
- Filter
- FlatColorPicker
- FloatingActionButton
- FloatingLabel
- Form
- Gantt
- Grid
- GridLayout
- InlineAIPrompt
- Installer and VS Extensions
- Licensing
- LinearGauge
- ListBox
- ListView
- Loader
- LoaderContainer
- Map
- MaskedTextBox
- MediaQuery
- Menu
- MultiColumnComboBox
- MultiSelect
- Notification
- NumericTextBox
- Page Templates / Building Blocks
- Pager
- PanelBar
- PDFViewer
- PivotGrid
- Popover
- Popup
- ProgressBar
- PromptBox
- QRCode
- RadialGauge
- RadioGroup
- RangeSlider
- Rating
- Scheduler
- SegmentedControl
- Signature
- Skeleton
- Slider
- SmartPasteButton
- SpeechToTextButton
- SplitButton
- Splitter
- Spreadsheet
- StackLayout
- Stepper
- StockChart
- Switch
- TabStrip
- TaskBoard
- TextArea
- TextBox
- TileLayout
- TimePicker
- ToggleButton
- ToolBar
- Tooltip
- TreeList
- TreeView
- Upload
- ValidationMessage
- ValidationSummary
- ValidationTooltip
- VS Code Extension
- WebMCP
- Window
- Wizard