Hello Roy,
From what I see online, a typical fan curve chart is just a collection of line charts, I'm pasting below a few examples of what I saw online when looking up what people call "fan curve chart" - those are possible right now. What you are seeking seems to be slightly different and seems to be called a "range area chart" more often. So that's how we call it in our products.
A range area chart is not available right now, that's the new item I advise you Follow: https://feedback.telerik.com/blazor/1475586-range-area-chart. It is the original request for a range area chart and it is the page that will get update when we implement such a chart. Clicking its own Follow button will send you emails for status updates on time.
Examples of Fan Curve Charts
This is something you could already do with our line charts.
https://airprofan.com/wp-content/uploads/2019/12/fan-performance-curve.png


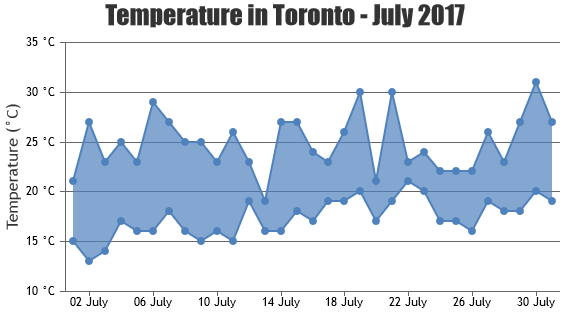
Examples of Range Area Charts
This is something that you need to wait for the Range Area Chart to be implemented - it is not possible yet.

Regards,
Marin Bratanov
Progress Telerik
Love the Telerik and Kendo UI products and believe more people should try them? Invite a fellow developer to become a Progress customer and each of you can get a $50 Amazon gift voucher.
When you say: "and that can already be achieved with our line charts or scatterline charts."
I do not see a way to accomplish a "Range Area Chart" with the existing line or scatterline charts in Blazor charts. Please show an example of a Range Area Chart in Blazor charts.
Thanks
Hello,
I have marked this as a duplicate of the Range Area chart because that's the general way we expose such a chart according to the original ticket that was submitted.
From what I see online, a typical fan curve chart is just a collection line series with a smooth curve that denote the performance of a given metric, and that can already be achieved with our line charts or scatterline charts.
Regards,
Marin Bratanov
Progress Telerik
Love the Telerik and Kendo UI products and believe more people should try them? Invite a fellow developer to become a Progress customer and each of you can get a $50 Amazon gift voucher.
- All
- Completed (1459)
- Declined (372)
- Duplicated (410)
- In Development (5)
- Need More Info (25)
- Planned (1)
- Under Review (2)
- Unplanned (1107)
- Won't Fix (23)
- All
- UI for Blazor
- Agentic UI Generator
- AIPrompt
- AnimationContainer
- AppBar
- ArcGauge
- AutoComplete
- Avatar
- Badge
- Barcode
- Breadcrumb
- BrowserExtension
- Button
- ButtonGroup
- Calendar
- Card
- Carousel
- Charts
- Chat
- Checkbox
- Chip
- ChipList
- ChunkProgressBar
- CircularGauge
- ColorGradient
- ColorPalette
- ColorPicker
- ComboBox
- ContextMenu
- DateInput
- DatePicker
- DateRangePicker
- DateTimePicker
- Diagram
- Dialog
- DockManager
- Drawer
- DropDownButton
- DropDownList
- DropDownTree
- DropZone
- Editor
- FileManager
- FileSelect
- Filter
- FlatColorPicker
- FloatingActionButton
- FloatingLabel
- Form
- Gantt
- Grid
- GridLayout
- InlineAIPrompt
- Installer and VS Extensions
- Licensing
- LinearGauge
- ListBox
- ListView
- Loader
- LoaderContainer
- Map
- MaskedTextBox
- MediaQuery
- Menu
- MultiColumnComboBox
- MultiSelect
- Notification
- NumericTextBox
- Page Templates / Building Blocks
- Pager
- PanelBar
- PDFViewer
- PivotGrid
- Popover
- Popup
- ProgressBar
- PromptBox
- QRCode
- RadialGauge
- RadioGroup
- RangeSlider
- Rating
- Scheduler
- SegmentedControl
- Signature
- Skeleton
- Slider
- SmartPasteButton
- SpeechToTextButton
- SplitButton
- Splitter
- Spreadsheet
- StackLayout
- Stepper
- StockChart
- Switch
- TabStrip
- TaskBoard
- TextArea
- TextBox
- TileLayout
- TimePicker
- ToggleButton
- ToolBar
- Tooltip
- TreeList
- TreeView
- Upload
- ValidationMessage
- ValidationSummary
- ValidationTooltip
- VS Code Extension
- WebMCP
- Window
- Wizard