Unplanned
Last Updated:
12 Jun 2024 11:35
by ADMIN
Juan Angel
Created on:
29 May 2024 19:38
Category:
Charts
Type:
Feature Request
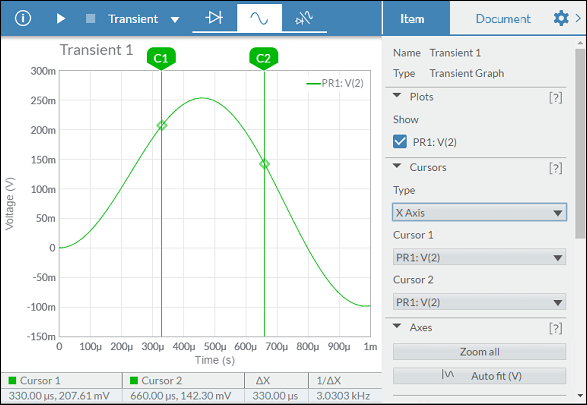
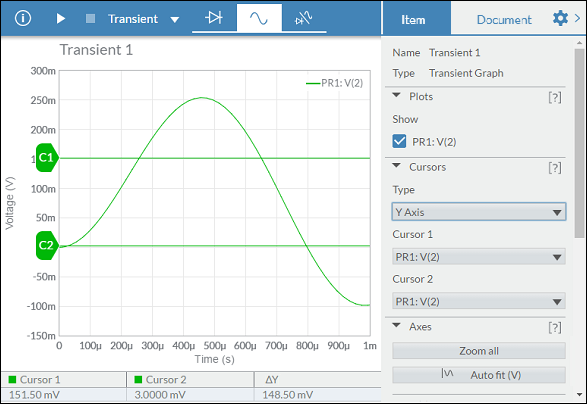
Moving cursors within the chart
This functionality would be very useful for data analysis.
Moving the cursors within the chart itself, allows to define a range within the series, being able to offer useful data.
Examples:
2 comments
Juan Angel
Posted on:
05 Jun 2024 16:13
I would need two movable cursors, that could be managed by the TelerikChart, with a "Start" and an "End" property and that would trigger an event that I can handle to evaluate the maximum, minimum, average... in the delimited period.
I imagine something like:
<ChartXAxis Type="date" BaseUnit="seconds">
<ChartXCursor From="CursorStart" To="CursorEnd" Color="#EAFFEF" OnCursorChanged="CursorChangedHandler" />
</ChartXAxis >
I have implemented something similar using ChartXAxisPlotBand of different colors, but the user cannot interact with the chart directly by changing the ChartXAxisPlotBand boundarie. They need use some external controls that define the start and end. I don't need to have several cursors, with several ChartXAxisPlotBand and a single cursor for the X axis and one for the Y axis is enough for my use cases.
In my case, zooming, is not one of my requirements.
Thanks!

ADMIN
Svetoslav Dimitrov
Posted on:
05 Jun 2024 10:44
Hello Juan Angel,
Can you follow up with some additional information based on the following questions:
- Are those lines created by the user, or by the application?
- Are those lines static or interactive?
- When you set the lines do you expect the chart to do something like zooming, or provide aggregates?
Regards,
Svetoslav Dimitrov
Progress Telerik
Stay tuned by visiting our public roadmap and feedback portal pages! Or perhaps, if you are new to our Telerik family, check out our getting started resources!
Type
Status
- All
- Completed (1457)
- Declined (372)
- Duplicated (410)
- In Development (3)
- Need More Info (25)
- Planned (1)
- Under Review (2)
- Unplanned (1106)
- Won't Fix (23)
Category
- All
- UI for Blazor
- Agentic UI Generator
- AIPrompt
- AnimationContainer
- AppBar
- ArcGauge
- AutoComplete
- Avatar
- Badge
- Barcode
- Breadcrumb
- BrowserExtension
- Button
- ButtonGroup
- Calendar
- Card
- Carousel
- Charts
- Chat
- Checkbox
- Chip
- ChipList
- ChunkProgressBar
- CircularGauge
- ColorGradient
- ColorPalette
- ColorPicker
- ComboBox
- ContextMenu
- DateInput
- DatePicker
- DateRangePicker
- DateTimePicker
- Diagram
- Dialog
- DockManager
- Drawer
- DropDownButton
- DropDownList
- DropDownTree
- DropZone
- Editor
- FileManager
- FileSelect
- Filter
- FlatColorPicker
- FloatingActionButton
- FloatingLabel
- Form
- Gantt
- Grid
- GridLayout
- InlineAIPrompt
- Installer and VS Extensions
- Licensing
- LinearGauge
- ListBox
- ListView
- Loader
- LoaderContainer
- Map
- MaskedTextBox
- MediaQuery
- Menu
- MultiColumnComboBox
- MultiSelect
- Notification
- NumericTextBox
- Page Templates / Building Blocks
- Pager
- PanelBar
- PDFViewer
- PivotGrid
- Popover
- Popup
- ProgressBar
- PromptBox
- QRCode
- RadialGauge
- RadioGroup
- RangeSlider
- Rating
- Scheduler
- SegmentedControl
- Signature
- Skeleton
- Slider
- SmartPasteButton
- SpeechToTextButton
- SplitButton
- Splitter
- Spreadsheet
- StackLayout
- Stepper
- StockChart
- Switch
- TabStrip
- TaskBoard
- TextArea
- TextBox
- TileLayout
- TimePicker
- ToggleButton
- ToolBar
- Tooltip
- TreeList
- TreeView
- Upload
- ValidationMessage
- ValidationSummary
- ValidationTooltip
- VS Code Extension
- WebMCP
- Window
- Wizard