Unplanned
Last Updated:
19 Feb 2026 08:17
by Peter
Ilan
Created on:
13 Jul 2023 10:59
Category:
Charts
Type:
Feature Request
Expose Zoom and Pan events with information about the zoomed/panned area
So the one thing that is missing for me from the zoom functionality is an event that tells me the selected values
i.e here I would like it to return: 2023/06/11 & 2023/06/18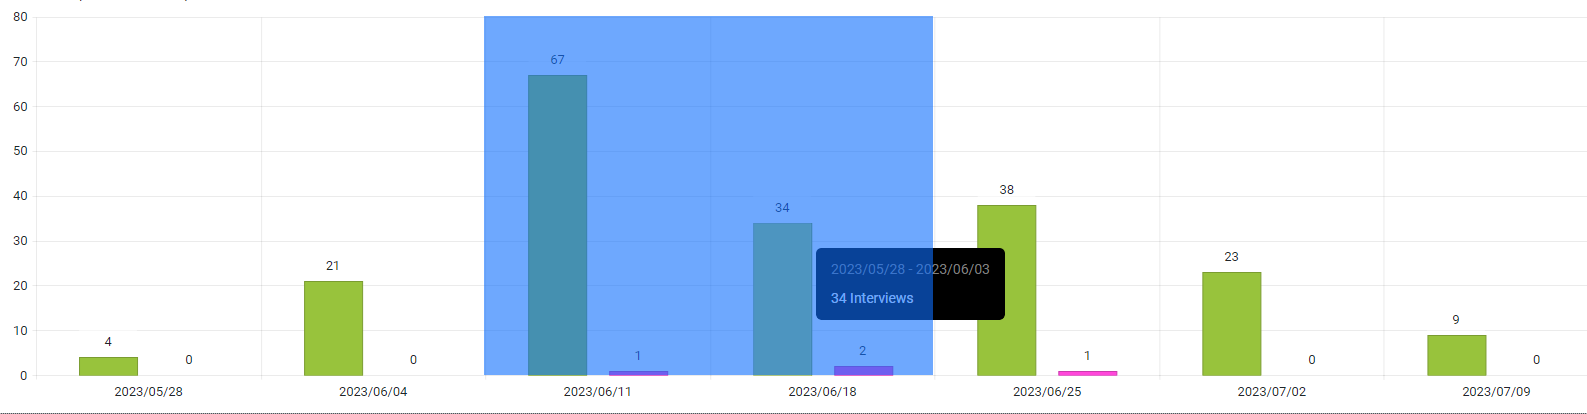
i.e here I would like it to return: 2023/06/11 & 2023/06/18
6 comments
Peter
Posted on:
19 Feb 2026 08:17
snippet link: https://blazorrepl.telerik.com/mgOGvZOi12DwHdqo29
Peter
Posted on:
19 Feb 2026 07:57
Working code for _Main.razor in https://blazorrepl.telerik.com, with console logging:
@inject IJSRuntime JSRuntime
@implements IAsyncDisposable
<h3>Chart Zoom Demo</h3>
<p>Left-mouse drag to select zoom area.</p>
<div style="margin: 10px 0; padding: 8px; background: #f0f0f0; border-radius: 4px;">
<strong>Current range:</strong> @XMin.ToString("dd.MM.yyyy") — @XMax.ToString("dd.MM.yyyy")
</div>
<div id="@_chartId">
<TelerikChart Height="350px">
<ChartZoomable Enabled="true">
<ChartZoomableSelection Enabled="true" Lock="ChartAxisLock.Y"
Key="ChartZoomableSelectionKey.None" />
</ChartZoomable>
<ChartSeriesItems>
<ChartSeries Type="ChartSeriesType.Scatter"
Data="@Data" Color="#0071ff"
XField="@nameof(SamplePoint.Date)"
YField="@nameof(SamplePoint.Value)">
<ChartSeriesMarkers Type="ChartSeriesMarkersType.Circle" Size="4" />
</ChartSeries>
</ChartSeriesItems>
<ChartXAxes>
<ChartXAxis Type="date" Min="@XMin" Max="@XMax">
<ChartXAxisLabels Format="{0:dd.MM.yy}" />
</ChartXAxis>
</ChartXAxes>
<ChartYAxes>
<ChartYAxis Min="0" Max="100" />
</ChartYAxes>
</TelerikChart>
</div>
<TelerikButton OnClick="@ResetZoom">Reset Zoom</TelerikButton>
@code {
string _chartId = "demo-chart";
DotNetObjectReference<__Main> _dotNetRef;
DateTime XMin = new DateTime(2025, 1, 1);
DateTime XMax = new DateTime(2025, 12, 31);
DateTime _originalMin, _originalMax;
List<SamplePoint> Data = new();
public class SamplePoint
{
public DateTime Date { get; set; }
public double Value { get; set; }
}
protected override void OnInitialized()
{
_dotNetRef = DotNetObjectReference.Create(this);
_originalMin = XMin;
_originalMax = XMax;
var rng = new Random(42);
var dt = new DateTime(2025, 1, 1);
while (dt <= new DateTime(2025, 12, 31))
{
Data.Add(new SamplePoint { Date = dt, Value = 30 + rng.NextDouble() * 40 });
dt = dt.AddDays(3);
}
}
protected override async Task OnAfterRenderAsync(bool firstRender)
{
if (firstRender)
{
await JSRuntime.InvokeVoidAsync("eval", @"
window._chartZoom = {
register: function(containerId, dotNetRef) {
var LOG = '[ChartZoom] ';
var attempts = 0;
function tryBind() {
attempts++;
console.log(LOG + 'attempt ' + attempts);
var container = document.getElementById(containerId);
if (!container) { console.log(LOG + 'no container'); retry(); return; }
var el = container.querySelector('.k-chart');
if (!el) { console.log(LOG + 'no .k-chart'); retry(); return; }
var dataId = el.dataset ? el.dataset.id : null;
console.log(LOG + 'data-id=' + dataId);
if (!dataId) { retry(); return; }
if (!window.TelerikBlazor || !TelerikBlazor.getComponentInstance) {
console.log(LOG + 'no TelerikBlazor'); retry(); return;
}
var wrapper = TelerikBlazor.getComponentInstance(dataId);
if (!wrapper) { console.log(LOG + 'no wrapper'); retry(); return; }
if (!wrapper.chartInstance) { console.log(LOG + 'no chartInstance'); retry(); return; }
var chart = wrapper.chartInstance;
if (!chart._plotArea || !chart._plotArea.axes) {
console.log(LOG + 'no _plotArea.axes'); retry(); return;
}
console.log(LOG + 'SUCCESS - bound to chart');
var lastMin = 0, lastMax = 0;
container.addEventListener('pointerup', function() {
console.log(LOG + 'pointerup');
setTimeout(function() {
var axes = chart._plotArea.axes;
for (var i = 0; i < axes.length; i++) {
var ax = axes[i];
if (ax && ax.options && ax.options.type === 'date' && typeof ax.range === 'function') {
var r = ax.range();
console.log(LOG + 'range=', r);
if (r && r.min != null && r.max != null) {
var mn = new Date(r.min), mx = new Date(r.max);
var mnT = mn.getTime(), mxT = mx.getTime();
if (mnT !== lastMin || mxT !== lastMax) {
lastMin = mnT; lastMax = mxT;
function pad(n) { return n < 10 ? '0'+n : ''+n; }
function fmt(d) {
return d.getFullYear()+'-'+pad(d.getMonth()+1)+'-'+pad(d.getDate())+
'T'+pad(d.getHours())+':'+pad(d.getMinutes())+':'+pad(d.getSeconds());
}
console.log(LOG + 'calling .NET: ' + fmt(mn) + ' -> ' + fmt(mx));
dotNetRef.invokeMethodAsync('OnZoomChanged', fmt(mn), fmt(mx));
}
}
break;
}
}
}, 300);
});
}
function retry() {
if (attempts < 40) setTimeout(tryBind, 250);
else console.error(LOG + 'GAVE UP after ' + attempts + ' attempts');
}
tryBind();
}
};
");
await JSRuntime.InvokeVoidAsync("_chartZoom.register", _chartId, _dotNetRef);
}
}
[JSInvokable]
public void OnZoomChanged(string minStr, string maxStr)
{
Console.WriteLine($"OnZoomChanged: {minStr} -> {maxStr}");
if (DateTime.TryParse(minStr, out var min) && DateTime.TryParse(maxStr, out var max))
{
XMin = min.Date;
XMax = max.Date.AddDays(1);
StateHasChanged();
}
}
void ResetZoom()
{
XMin = _originalMin;
XMax = _originalMax;
}
public ValueTask DisposeAsync()
{
_dotNetRef?.Dispose();
return ValueTask.CompletedTask;
}
}
Ilan
Posted on:
18 Feb 2026 20:30
What am I missing here?
Telerik REPL for Blazor - The best place to play, experiment, share & learn using Blazor.
Peter
Posted on:
18 Feb 2026 20:06
Sure! Here's a minimal working example for Telerik.UI.for.Blazor 13.0.0.
1. JavaScript — wwwroot/js/chart-zoom-sync.js
window.chartZoomInterop = (function () {
var registrations = {};
function getChartInstance(containerId) {
var container = document.getElementById(containerId);
if (!container) return null;
var el = container.querySelector('.k-chart');
if (!el) return null;
var dataId = el.dataset ? el.dataset.id : null;
if (!dataId || !window.TelerikBlazor || !TelerikBlazor.getComponentInstance) return null;
var wrapper = TelerikBlazor.getComponentInstance(dataId);
return (wrapper && wrapper.chartInstance) ? wrapper.chartInstance : null;
}
function readDateAxisRange(chart) {
if (!chart._plotArea || !chart._plotArea.axes) return null;
var axes = chart._plotArea.axes;
for (var i = 0; i < axes.length; i++) {
var ax = axes[i];
if (ax && ax.options && ax.options.type === 'date' && typeof ax.range === 'function') {
var r = ax.range();
if (r && r.min != null && r.max != null) {
return { min: new Date(r.min), max: new Date(r.max) };
}
}
}
return null;
}
function pad(n) { return n < 10 ? '0' + n : '' + n; }
function formatDate(d) {
return d.getFullYear() + '-' + pad(d.getMonth() + 1) + '-' + pad(d.getDate()) +
'T' + pad(d.getHours()) + ':' + pad(d.getMinutes()) + ':' + pad(d.getSeconds());
}
return {
register: function (containerId, dotNetRef) {
// Retry until the Kendo chart widget is ready (rendered async by Blazor)
var attempts = 0;
function tryBind() {
var chart = getChartInstance(containerId);
if (chart) {
var lastMin = 0, lastMax = 0;
var timer = null;
var container = document.getElementById(containerId);
container.addEventListener('mouseup', function () {
if (timer) clearTimeout(timer);
timer = setTimeout(function () {
var range = readDateAxisRange(chart);
if (range && !isNaN(range.min) && !isNaN(range.max)) {
var minT = range.min.getTime(), maxT = range.max.getTime();
if (minT !== lastMin || maxT !== lastMax) {
lastMin = minT; lastMax = maxT;
dotNetRef.invokeMethodAsync('OnZoomChanged',
formatDate(range.min), formatDate(range.max));
}
}
}, 150);
});
registrations[containerId] = true;
} else if (attempts < 30) {
attempts++;
setTimeout(tryBind, 200);
}
}
if (!registrations[containerId]) tryBind();
}
};
})();
2. Razor Component — ZoomableChart.razor
@inject IJSRuntime JSRuntime
@implements IAsyncDisposable
<div id="@_chartId">
<TelerikChart>
<ChartZoomable Enabled="true">
<ChartZoomableSelection Enabled="true" Lock="ChartAxisLock.Y"
Key="ChartZoomableSelectionKey.None" />
</ChartZoomable>
<ChartSeriesItems>
<ChartSeries Type="ChartSeriesType.Scatter"
Data="@Data"
XField="@nameof(SamplePoint.Date)"
YField="@nameof(SamplePoint.Value)" />
</ChartSeriesItems>
<ChartXAxes>
<ChartXAxis Type="date" Min="@XMin" Max="@XMax">
<ChartXAxisLabels Format="{0:dd.MM.yy}" />
</ChartXAxis>
</ChartXAxes>
</TelerikChart>
</div>
<p><strong>Zoomed range:</strong> @XMin?.ToString("dd.MM.yyyy") — @XMax?.ToString("dd.MM.yyyy")</p>
@code {
string _chartId = "chart-" + Guid.NewGuid().ToString("N");
DotNetObjectReference<ZoomableChart> _dotNetRef;
[Parameter] public List<SamplePoint> Data { get; set; }
[Parameter] public DateTime? XMin { get; set; }
[Parameter] public DateTime? XMax { get; set; }
[Parameter] public EventCallback<(DateTime min, DateTime max)> OnZoomRangeChanged { get; set; }
public class SamplePoint
{
public DateTime Date { get; set; }
public double Value { get; set; }
}
protected override void OnInitialized()
=> _dotNetRef = DotNetObjectReference.Create(this);
protected override async Task OnAfterRenderAsync(bool firstRender)
=> await JSRuntime.InvokeVoidAsync("chartZoomInterop.register", _chartId, _dotNetRef);
[JSInvokable]
public async Task OnZoomChanged(string minStr, string maxStr)
{
if (DateTime.TryParse(minStr, out var min) && DateTime.TryParse(maxStr, out var max))
await OnZoomRangeChanged.InvokeAsync((min, max));
}
public async ValueTask DisposeAsync()
{
_dotNetRef?.Dispose();
}
}
3. Host page — add the script reference after telerik-blazor.js:
<script src="_content/Telerik.UI.for.Blazor/js/telerik-blazor.js"></script>
<script src="js/chart-zoom-sync.js"></script>
How it works: Left-mouse drag selects a zoom region. On mouseup, the JS reads the new axis range from chartInstance._plotArea.axes and calls back into Blazor. The parent page receives
the new min/max via OnZoomRangeChanged and can use it to synchronize other charts or display the range.
Important: This relies on undocumented internals (TelerikBlazor.getComponentInstance, chartInstance._plotArea). Tested with v13.0.0 — may need adjustment after major Telerik updates.
Ilan
Posted on:
18 Feb 2026 19:58
Thank you very much for the update! Can you please provide a working example?
Peter
Posted on:
18 Feb 2026 19:52
Workaround: Reading zoom/pan range via internal API (Telerik.UI.for.Blazor 13.0.0)
While waiting for official event support, we implemented a JavaScript-based workaround that reads the zoomed axis range from the chart's internal rendering objects. This allows
synchronizing zoom across multiple charts on the same page (e.g. one chart per axle position, all sharing the same X-axis time range).
Approach:
1. Wrap each <TelerikChart> in a <div id="@uniqueId">.
2. Enable zoom: <ChartZoomableSelection Enabled="true" Lock="ChartAxisLock.Y" />
3. In JavaScript, access the chart instance via:
var el = document.getElementById(chartId).querySelector('.k-chart');
var dataId = el.dataset.id;
var wrapper = TelerikBlazor.getComponentInstance(dataId);
var chart = wrapper.chartInstance;
4. Read the current axis range after zoom completes:
var axes = chart._plotArea.axes;
for (var i = 0; i < axes.length; i++) {
if (axes[i].options.type === 'date') {
var range = axes[i].range(); // { min, max }
}
}
5. Detect zoom completion via a DOM mouseup event listener on the chart container (with 150ms debounce), then call back into Blazor via DotNetObjectReference.invokeMethodAsync().
Caveats:
- This depends on undocumented internals (TelerikBlazor.getComponentInstance, chartInstance._plotArea.axes). It works with v13.0.0 but may break in future major versions.
- There is no reliable internal event for zoom/pan completion — mouseup on the container is the most practical trigger.
- We added runtime version checks that log console warnings if the Telerik version changes.
A proper Blazor event (e.g. OnZoomEnd / OnPanEnd with axis range data) would eliminate this fragile dependency entirely.
Type
Status
- All
- Completed (1457)
- Declined (372)
- Duplicated (410)
- In Development (3)
- Need More Info (25)
- Planned (1)
- Under Review (2)
- Unplanned (1106)
- Won't Fix (23)
Category
- All
- UI for Blazor
- Agentic UI Generator
- AIPrompt
- AnimationContainer
- AppBar
- ArcGauge
- AutoComplete
- Avatar
- Badge
- Barcode
- Breadcrumb
- BrowserExtension
- Button
- ButtonGroup
- Calendar
- Card
- Carousel
- Charts
- Chat
- Checkbox
- Chip
- ChipList
- ChunkProgressBar
- CircularGauge
- ColorGradient
- ColorPalette
- ColorPicker
- ComboBox
- ContextMenu
- DateInput
- DatePicker
- DateRangePicker
- DateTimePicker
- Diagram
- Dialog
- DockManager
- Drawer
- DropDownButton
- DropDownList
- DropDownTree
- DropZone
- Editor
- FileManager
- FileSelect
- Filter
- FlatColorPicker
- FloatingActionButton
- FloatingLabel
- Form
- Gantt
- Grid
- GridLayout
- InlineAIPrompt
- Installer and VS Extensions
- Licensing
- LinearGauge
- ListBox
- ListView
- Loader
- LoaderContainer
- Map
- MaskedTextBox
- MediaQuery
- Menu
- MultiColumnComboBox
- MultiSelect
- Notification
- NumericTextBox
- Page Templates / Building Blocks
- Pager
- PanelBar
- PDFViewer
- PivotGrid
- Popover
- Popup
- ProgressBar
- PromptBox
- QRCode
- RadialGauge
- RadioGroup
- RangeSlider
- Rating
- Scheduler
- SegmentedControl
- Signature
- Skeleton
- Slider
- SmartPasteButton
- SpeechToTextButton
- SplitButton
- Splitter
- Spreadsheet
- StackLayout
- Stepper
- StockChart
- Switch
- TabStrip
- TaskBoard
- TextArea
- TextBox
- TileLayout
- TimePicker
- ToggleButton
- ToolBar
- Tooltip
- TreeList
- TreeView
- Upload
- ValidationMessage
- ValidationSummary
- ValidationTooltip
- VS Code Extension
- WebMCP
- Window
- Wizard