Planned
Last Updated: 27 Sep 2023 09:17 by Mark
Fairoz
Created on: 18 Mar 2021 15:18
Category: Charts
Type: Feature Request
32
Easy to draw Horizontal and Vertical lines in the charts

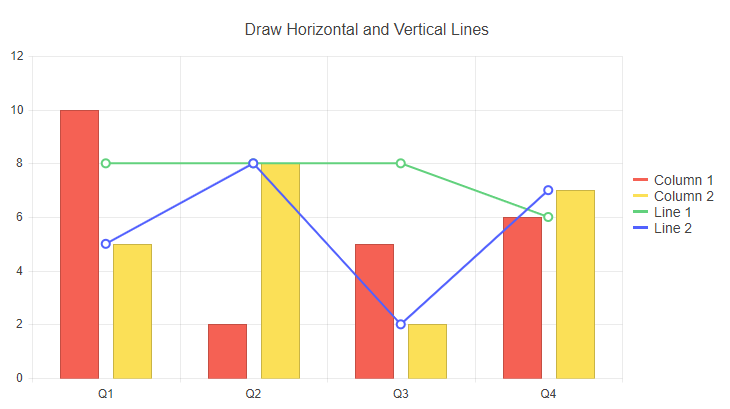
I want horizontal and vertical lines in the chart to act as markers (limits, thresholds). It would be awesome if there was a way to simply draw a horizontal and vertical lines, bound to a collection of y and x data respectively.

Something like the below would be nice 

    <TelerikChart>
        <ChartSeriesItems>
            <ChartSeries Type="@ChartSeriesType.Line" Name="@P_Name1" Color="blue"
                         Data="@P_Data1"
                         Field="@P_Field1"
                         CategoryField="@P_CategoryField1">
                <ChartSeriesLabels Visible="true" Template="#=dataItem.P_Description#" />
                <ChartSeriesMarkers Size="4" />
            </ChartSeries>
            <ChartHorizontalLines Data="@YLinesData"/>
            <ChartVerticalLines Data="@XLinesData"/>
        </ChartSeriesItems>
</TelerikChart>

@code{

List<double> YLinesData, XLinesData;

}

---

ADMIN EDIT

You can find some more details and ideas for workarounds here to consider in the meantime.

---

Duplicated Items
3 comments
Mark
Posted on: 27 Sep 2023 09:17

Hi Hristian


As we approach 12 months in "Planned" status, can we expect a release number soon?

Thank you

ADMIN
Hristian Stefanov
Posted on: 22 Nov 2022 12:32

Hi Sylvain,

The feature status is changed to "Planned". That means the task is in the short-term backlog now, and as a next step, a release number will appear as well.

I suggest continuing tracking here.

Regards,
Hristian Stefanov
Progress Telerik

Virtual Classroom, the free self-paced technical training that gets you up to speed with Telerik and Kendo UI products quickly just got a fresh new look + new and improved content including a brand new Blazor course! Check it out at https://learn.telerik.com/.

Sylvain
Posted on: 15 Nov 2022 16:56
No news about this feature ?