Use the following setup:
private void RadForm1_Load(object sender, EventArgs e)
{
// TODO: This line of code loads data into the 'nwindDataSet.Orders' table. You can move, or remove it, as needed.this.ordersTableAdapter.Fill(this.nwindDataSet.Orders);
this.radPivotGrid1.RowGroupDescriptions.Add(new DateTimeGroupDescription() { PropertyName = "OrderDate", Step = DateTimeStep.Year, GroupComparer = new GroupNameComparer() });
this.radPivotGrid1.RowGroupDescriptions.Add(new DateTimeGroupDescription() { PropertyName = "OrderDate", Step = DateTimeStep.Quarter, GroupComparer = new GroupNameComparer() });
this.radPivotGrid1.RowGroupDescriptions.Add(new DateTim
eGroupDescription() { PropertyName = "OrderDate", Step = DateTimeStep.Month, GroupComparer = new GroupNameComparer() });
this.radPivotGrid1.ColumnGroupDescriptions.Add(new PropertyGroupDescription() { PropertyName = "EmployeeID", GroupComparer = new GrandTotalComparer() });
this.radPivotGrid1.AggregateDescriptions.Add(new PropertyAggregateDescription() { PropertyName = "Freight", AggregateFunction = AggregateFunctions.Sum });
this.radPivotGrid1.AggregateDescriptions.Add(new PropertyAggregateDescription() { PropertyName = "Freight", AggregateFunction = AggregateFunctions.Average });
this.radPivotGrid1.FilterDescriptions.Add(new PropertyFilterDescription() { PropertyName = "ShipCountry", CustomName = "Country" });
this.radPivotGrid1.DataSource = this.ordersBindingSource;
this.radPivotGrid1.ChartDataProvider.UpdateCompleted += radPivotGrid1_UpdateCompleted;
this.radChartView1.DataSource = this.radPivotGrid1;
}
private void radPivotGrid1_UpdateCompleted(object sender, EventArgs e)
{
foreach (CartesianSeries series inthis.radChartView1.Series)
{
series.ShowLabels = true;
series.LabelRotationAngle = 90;
}
}
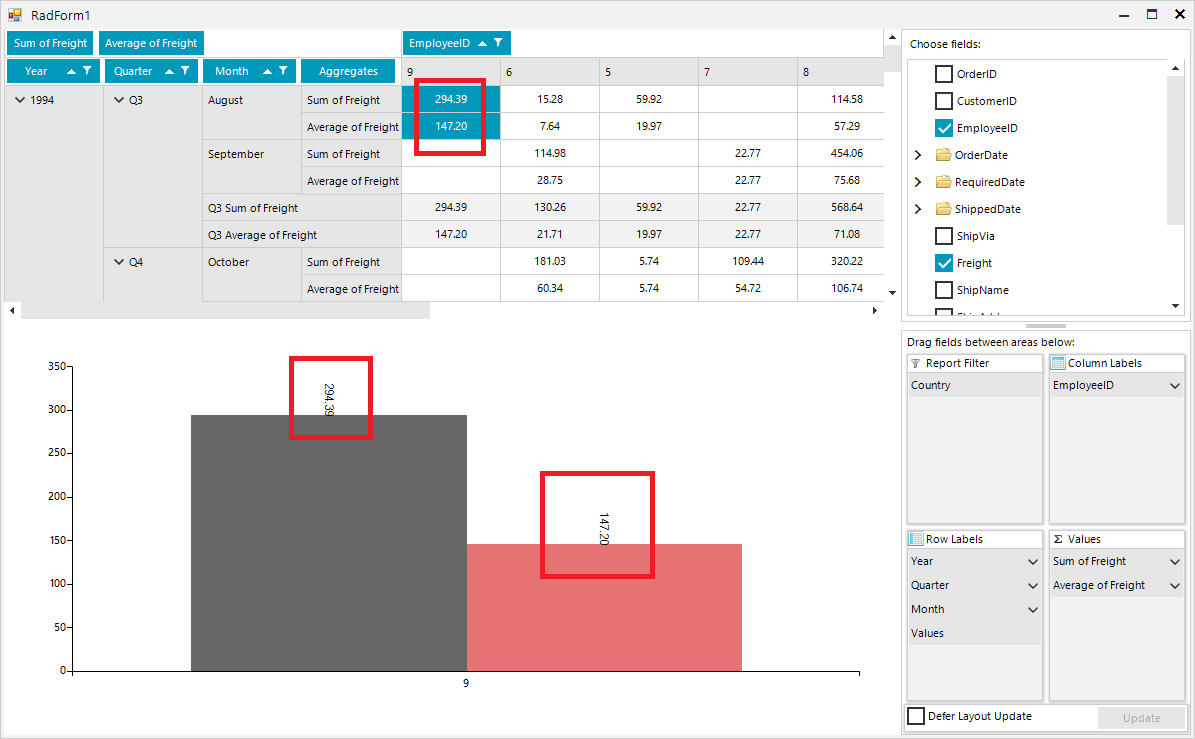
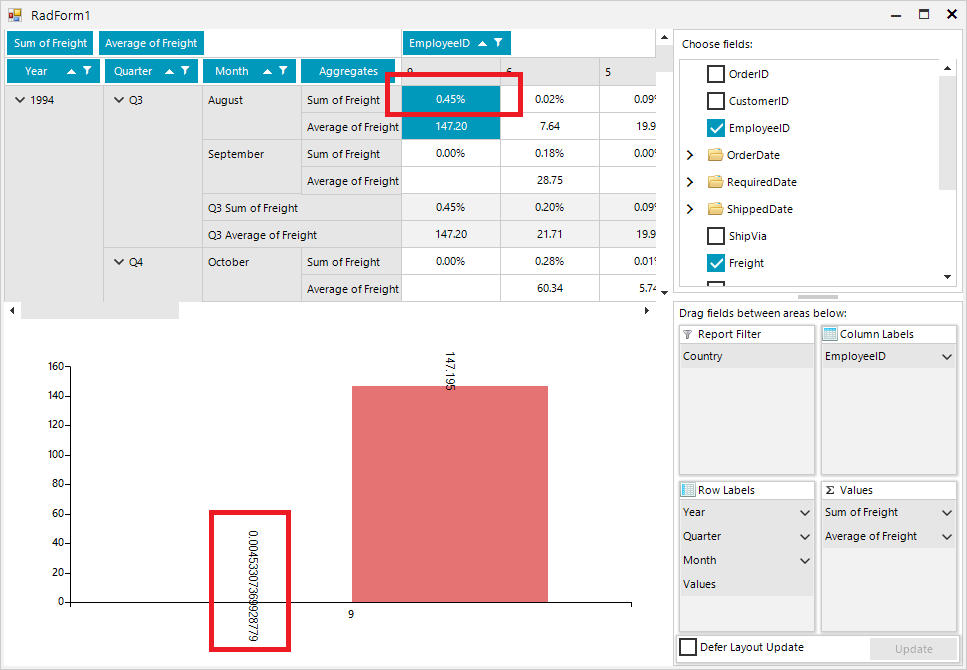
Once you select "% of Grand Total" for one of the aggregates, it would be good the respective chart labels to be formatted in a similar way out of the box:

Desired Behavior:
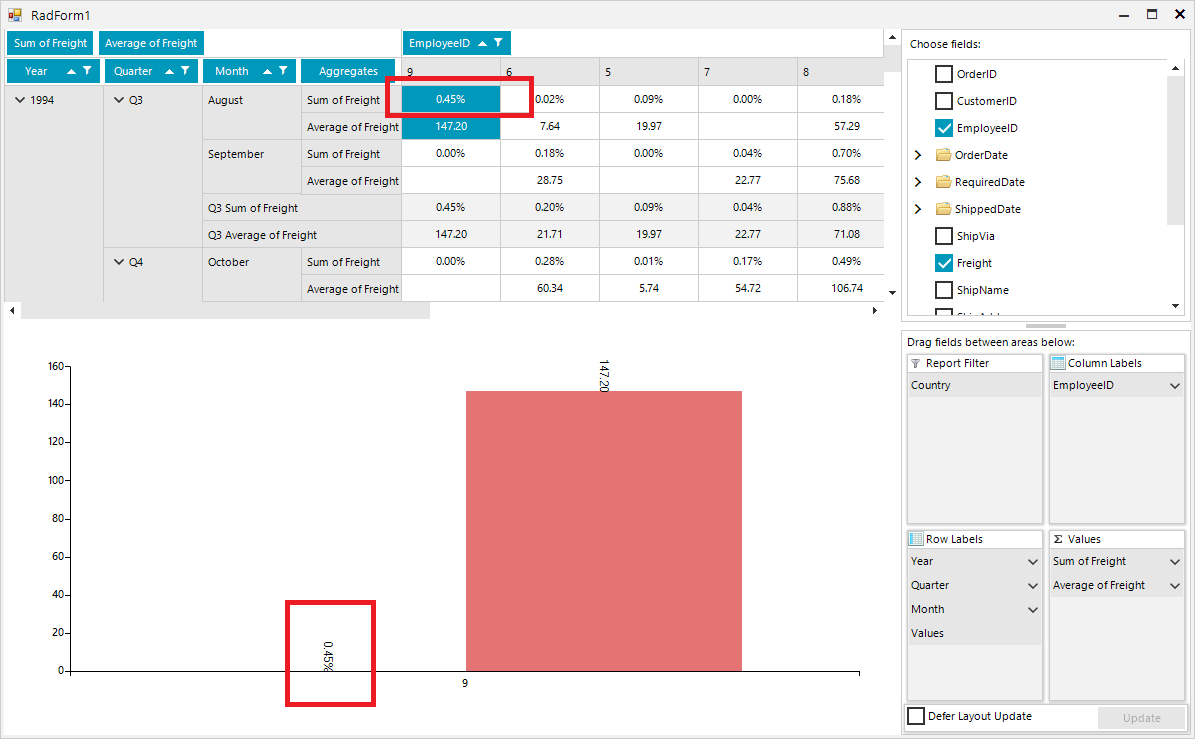
Actual behavior: