3D Charts will be a nice addition to the WinForms suite
Legend Item Text is not visible in Windows11Dark. This is because the LegendItem A possible workaround is to subscribe to the VisualItemCreating event. In the event handler, we can create a new LegendItemElement and set its ForeColor.
private void LegendElement_VisualItemCreating(object sender, LegendItemElementCreatingEventArgs e)
{
    e.ItemElement = new LegendItemElement(e.LegendItem) { ForeColor = Color.Black };
}
Currently, VisualStudio2012DarkTheme has a white background in order to be able to read the labels. This change was done when addressing this item:
However, it is inconsistent a dark theme to have a white background color. The design should be improved to achieve consistent look and feel.
Allow user to export current view as an image.
Before zoom:
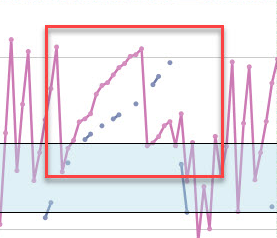
After zoom:

Hello Telerik Support,
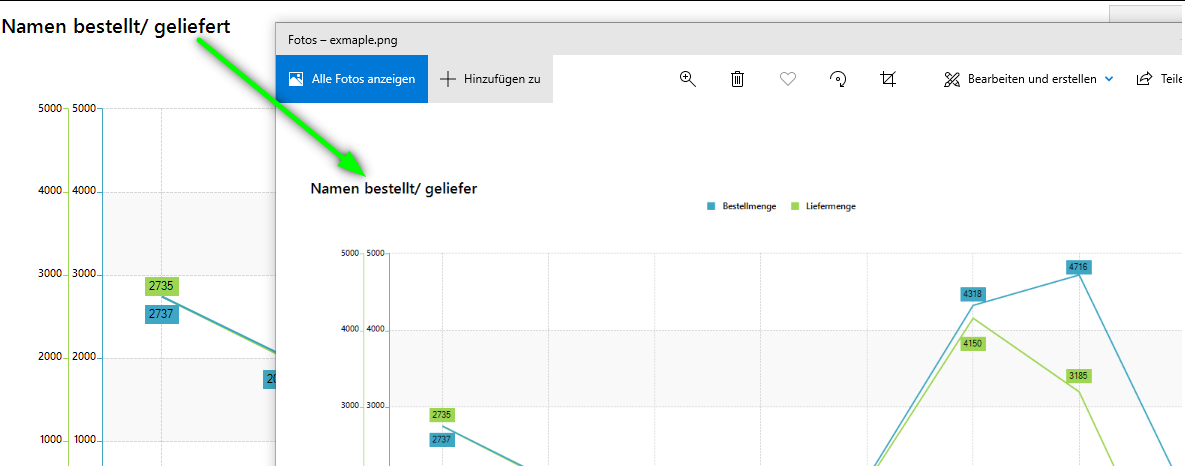
after taking my first steps with RangeSelector and ChartView controls I found an issue with a simple bar chart. The length of some bars in the chart of the RangeSelector doesn't match with the bars in the ChartView. The relation is wrong.I provided a screenshot and marked the bars. I could provide a sample application, but I can't attach a zip file, so here's the code of the main form:
using System;using System.Collections.Generic;using System.ComponentModel;using System.Data;using System.Drawing;using System.Linq;using System.Text;using System.Windows.Forms;using Telerik.WinControls;using Telerik.WinControls.UI;namespace TelerikChartView{ public partial class MainForm : Telerik.WinControls.UI.RadForm { private List<Kapazitaetspunkt> _BackListPunkte; private BindingList<Kapazitaetspunkt> Punkte; public MainForm() { InitializeComponent(); } private void MainForm_Load(object sender, EventArgs e) { _BackListPunkte = new List<Kapazitaetspunkt>(); Punkte = new BindingList<Kapazitaetspunkt>(_BackListPunkte); //Punkte = new BindingList<Kapazitaetspunkt>(); rngTimeSelector.AssociatedControl = cvChart; rngTimeSelector.RangeSelectorElement.ScrollSelectorElement.Visibility = ElementVisibility.Collapsed; BarSeries bars = new BarSeries(); bars.DataSource = Punkte; bars.ValueMember = nameof(Kapazitaetspunkt.Percentage); bars.CategoryMember = nameof(Kapazitaetspunkt.Date); cvChart.Series.Add(bars); } private void GenerateTestData(int addMonths = 0) { Punkte.Clear(); const int count = 25; const int step = 4; var von = DateTime.Today.AddMonths(addMonths); var bis = von.AddDays(count); double percentage = 0; //_BackListPunkte.Add(new Kapazitaetspunkt(von.AddDays(-1), null)); Punkte.Add(new Kapazitaetspunkt(von.AddDays(-1), null)); while (von < bis) { //_BackListPunkte.Add(new Kapazitaetspunkt(von, percentage)); Punkte.Add(new Kapazitaetspunkt(von, percentage)); percentage += step; von = von.AddDays(1); } //_BackListPunkte.Add(new Kapazitaetspunkt(von.AddDays(1), null)); Punkte.Add(new Kapazitaetspunkt(von.AddDays(1), null)); } private void btnGenerateData_Click(object sender, EventArgs e) { GenerateTestData(); rngTimeSelector.RangeSelectorElement.InitializeElements(); rngTimeSelector.RangeSelectorElement.ResetLayout(true); } private void btnGenerateData2_Click(object sender, EventArgs e) { GenerateTestData(2); rngTimeSelector.RangeSelectorElement.InitializeElements(); rngTimeSelector.RangeSelectorElement.ResetLayout(true); } private void rngTimeSelector_ScaleInitializing(object sender, ScaleInitializingEventArgs e) { e.Cancel = true; } } public class Kapazitaetspunkt : INotifyPropertyChanged { private DateTime _Date; public DateTime Date { get => _Date; set { if (value != Date) { _Date = value; OnPropertyChanged(); } } } public double? _Percentage; public double? Percentage { get => _Percentage; set { if (value != Percentage) { _Percentage = value; OnPropertyChanged(); } } } public Kapazitaetspunkt(DateTime date, double? percentage) { Date = date; Percentage = percentage; } public event PropertyChangedEventHandler PropertyChanged; protected virtual void OnPropertyChanged([CallerMemberName] string propertyName = null) { PropertyChanged?.Invoke(this, new PropertyChangedEventArgs(propertyName)); } }}Regards,
Stephan
Use the following setup:
private void RadForm1_Load(object sender, EventArgs e)
{
// TODO: This line of code loads data into the 'nwindDataSet.Orders' table. You can move, or remove it, as needed.this.ordersTableAdapter.Fill(this.nwindDataSet.Orders);
this.radPivotGrid1.RowGroupDescriptions.Add(new DateTimeGroupDescription() { PropertyName = "OrderDate", Step = DateTimeStep.Year, GroupComparer = new GroupNameComparer() });
this.radPivotGrid1.RowGroupDescriptions.Add(new DateTimeGroupDescription() { PropertyName = "OrderDate", Step = DateTimeStep.Quarter, GroupComparer = new GroupNameComparer() });
this.radPivotGrid1.RowGroupDescriptions.Add(new DateTim
eGroupDescription() { PropertyName = "OrderDate", Step = DateTimeStep.Month, GroupComparer = new GroupNameComparer() });
this.radPivotGrid1.ColumnGroupDescriptions.Add(new PropertyGroupDescription() { PropertyName = "EmployeeID", GroupComparer = new GrandTotalComparer() });
this.radPivotGrid1.AggregateDescriptions.Add(new PropertyAggregateDescription() { PropertyName = "Freight", AggregateFunction = AggregateFunctions.Sum });
this.radPivotGrid1.AggregateDescriptions.Add(new PropertyAggregateDescription() { PropertyName = "Freight", AggregateFunction = AggregateFunctions.Average });
this.radPivotGrid1.FilterDescriptions.Add(new PropertyFilterDescription() { PropertyName = "ShipCountry", CustomName = "Country" });
this.radPivotGrid1.DataSource = this.ordersBindingSource;
this.radPivotGrid1.ChartDataProvider.UpdateCompleted += radPivotGrid1_UpdateCompleted;
this.radChartView1.DataSource = this.radPivotGrid1;
}
private void radPivotGrid1_UpdateCompleted(object sender, EventArgs e)
{
foreach (CartesianSeries series inthis.radChartView1.Series)
{
series.ShowLabels = true;
series.LabelRotationAngle = 90;
}
}
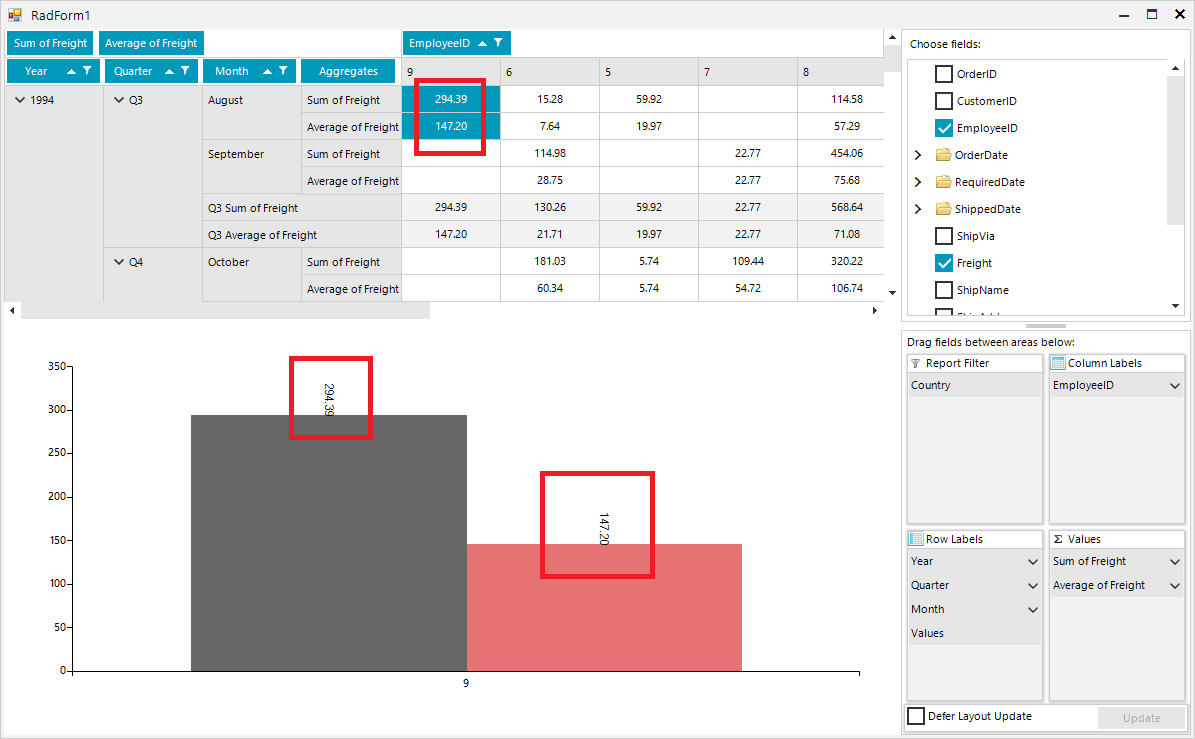
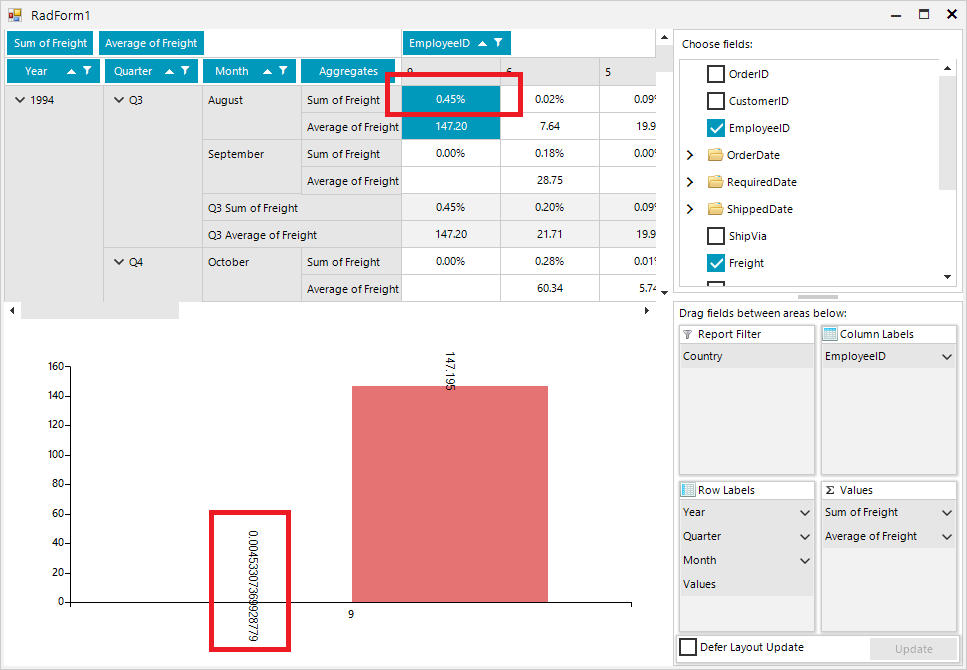
Once you select "% of Grand Total" for one of the aggregates, it would be good the respective chart labels to be formatted in a similar way out of the box:

Desired Behavior:
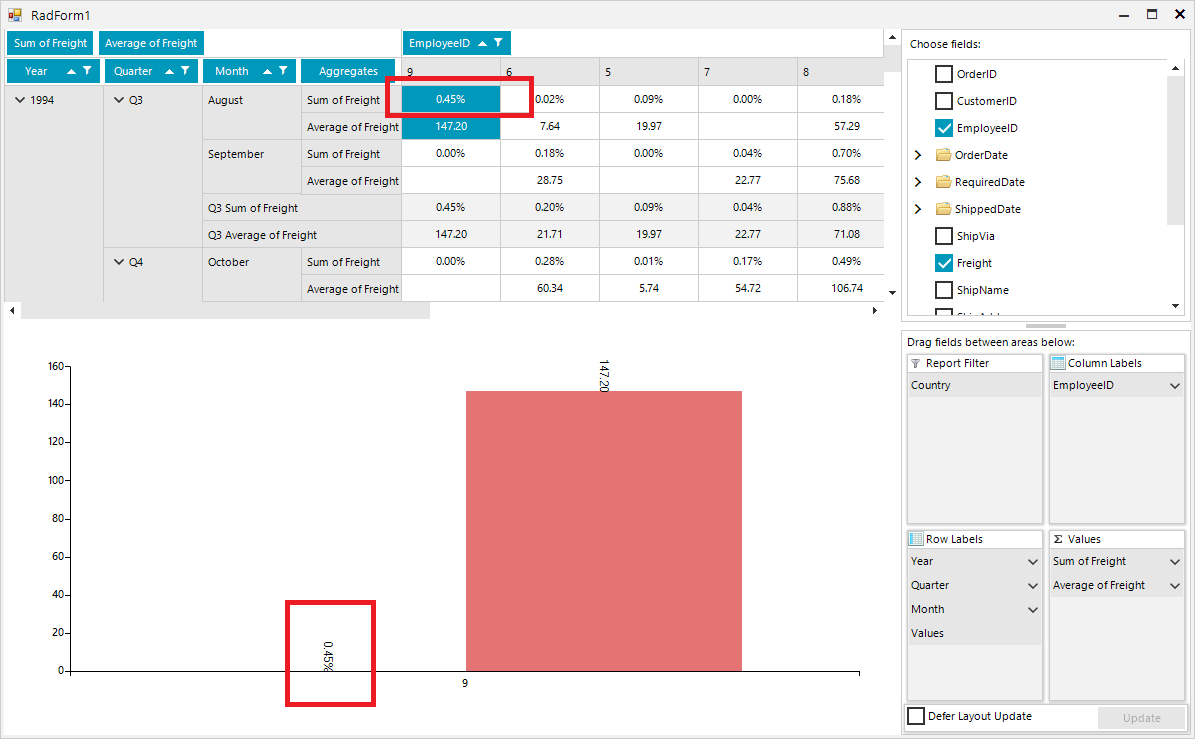
Actual behavior:
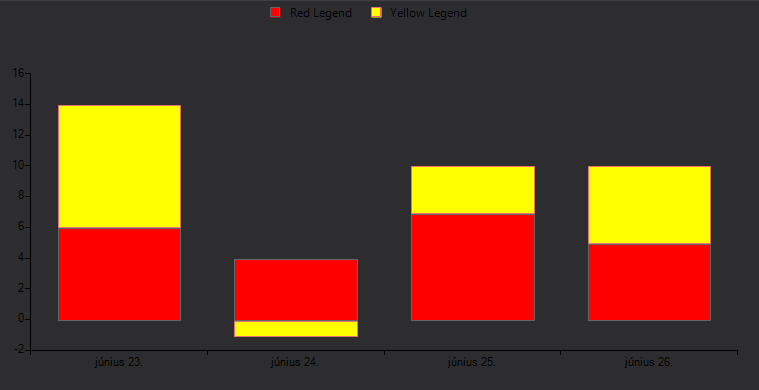
Please refer to the attached sample project. Try to select a point.
Expected result: the clicked point should be colored in red.
Actual result: a random point is colored in red even though the label is colored correctly. The attached gif file illustrates the observed result.
Please use the following code snippet and click the button to print the chart:
        public RadForm1()
        {
            InitializeComponent();

            Random rand = new Random();
            for (int i = 0; i < 50; i++)
            {
                LineSeries lineSeries = new LineSeries();
                lineSeries.LegendTitle = "Series" + i;
                lineSeries.DataPoints.Add(new CategoricalDataPoint(rand.Next(0,20), "Jan"));
                lineSeries.DataPoints.Add(new CategoricalDataPoint(rand.Next(0,20), "Apr"));
                lineSeries.DataPoints.Add(new CategoricalDataPoint(rand.Next(0,20), "Jul"));
                lineSeries.DataPoints.Add(new CategoricalDataPoint(rand.Next(0,20), "Oct"));
                this.radChartView1.Series.Add(lineSeries);
            }
            this.radChartView1.ShowLegend = true;
            this.radChartView1.ChartElement.LegendPosition = LegendPosition.Bottom;
        }

        private void radButton1_Click(object sender, EventArgs e)
        {
            this.radChartView1.PrintPreview();
        }
Expected:
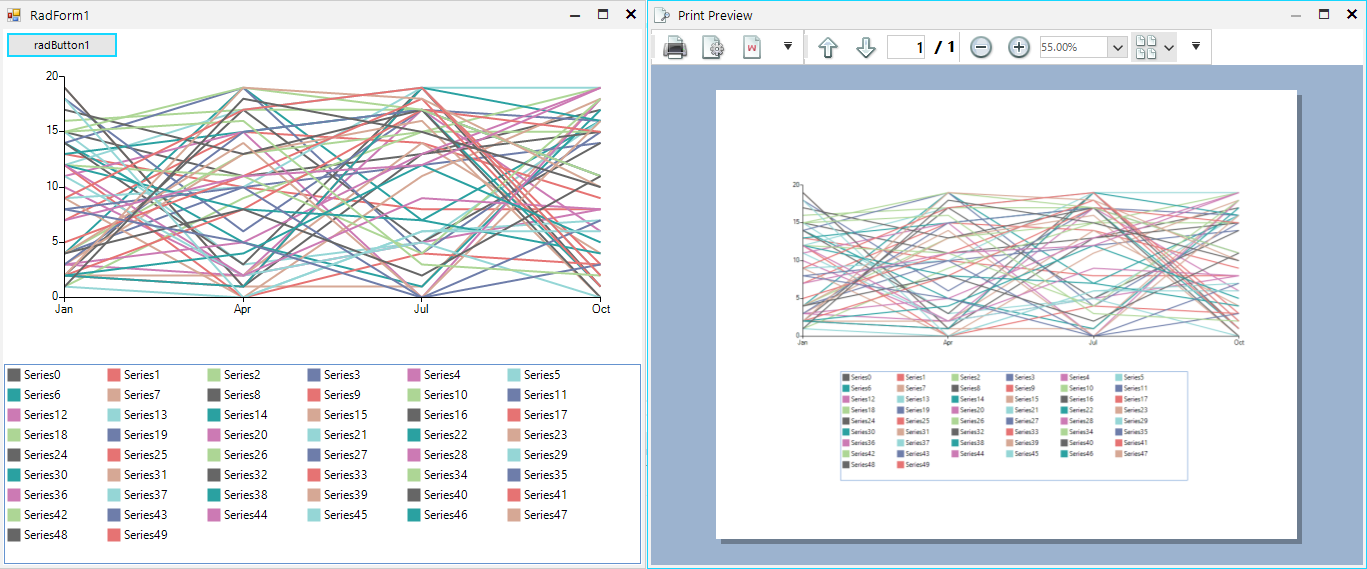
Actual:
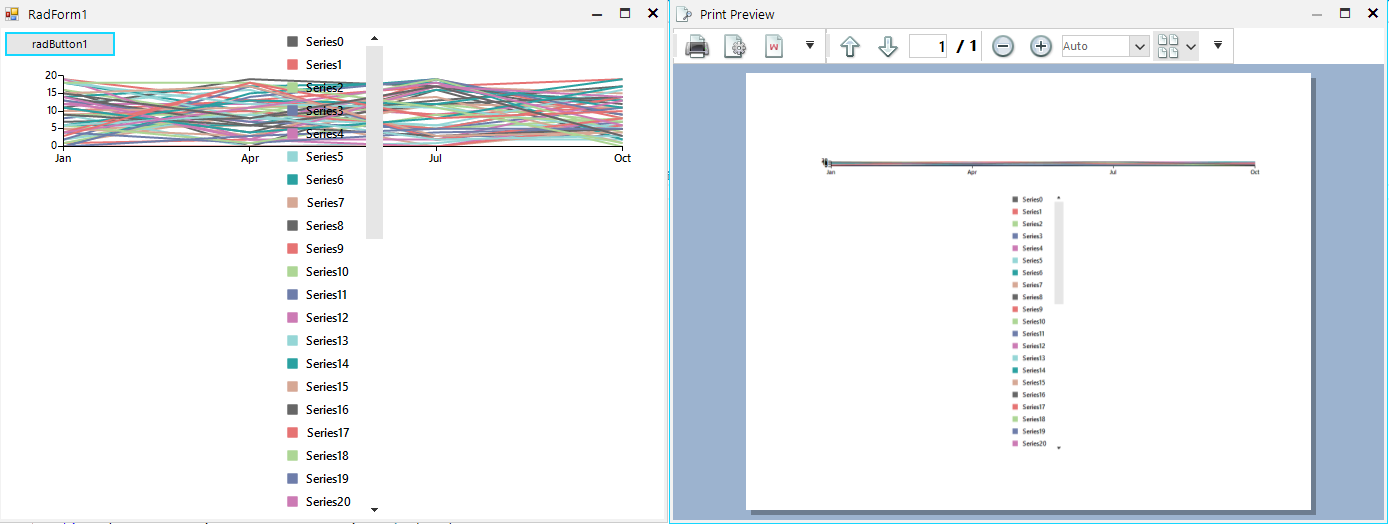
Workaround:
https://docs.telerik.com/devtools/winforms/knowledge-base/chartview-wrap-legend-items
         internal class MyChart : RadChartView
        {
            protected override RadChartElement CreateChartElement()
            {
                return new MyChartElement();
            }
        }

        internal class MyChartElement : RadChartElement
        {
            protected override ChartLegendElement CreateChartLegendElement()
            {
                return new MyLegendElement(this);
            }

            protected override Type ThemeEffectiveType
            {
                get
                {
                    return typeof(RadChartElement);
                }
            }
        }

        internal class MyLegendElement : ChartLegendElement
        {
            private RadListViewElement panel;

            public MyLegendElement(RadChartElement chartElement) : base(chartElement)
            {
            }

            protected override void OnLegendInfosCollectionChanged(Telerik.WinControls.Data.NotifyCollectionChangedEventArgs e, bool providerChange)
            {
                base.OnLegendInfosCollectionChanged(e, providerChange);
                if (e.Action == Telerik.WinControls.Data.NotifyCollectionChangedAction.Add)
                {
                    LegendItem li = e.NewItems[0] as LegendItem;
                    panel.Items.Add(li.Title);
                    panel.Items.Last().Tag = li.Element;
                }
                panel.SelectedIndex = -1;
            }

            protected override void CreateChildElements()
            {
                base.CreateChildElements();
                panel = new RadListViewElement();
                panel.VisualItemFormatting += ListView_VisualItemFormatting;
                panel.ShowCheckBoxes = true;
                panel.StretchHorizontally = true;
                panel.StretchVertically = false;
                panel.ViewType = ListViewType.IconsView;
                panel.ItemSize = new System.Drawing.Size(100, 20);
                panel.ShouldHandleMouseInput = true;
                panel.NotifyParentOnMouseInput = false;
                panel.MaxSize = new System.Drawing.Size(int.MaxValue, 200);
                this.StackElement.Visibility = Telerik.WinControls.ElementVisibility.Collapsed;
                this.Children.Add(panel);
            }

            protected override Type ThemeEffectiveType
            {
                get
                {
                    return typeof(ChartLegendElement);
                }
            }

            private void ListView_VisualItemFormatting(object sender, ListViewVisualItemEventArgs e)
            {
                ListViewItemCheckbox checkBox = e.VisualItem.ToggleElement as ListViewItemCheckbox;
                if (checkBox != null)
                {
                    e.VisualItem.ToggleElement.ShouldHandleMouseInput = false;
                    e.VisualItem.ToggleElement.NotifyParentOnMouseInput = false;
                    checkBox.CheckMarkPrimitive.Fill.BackColor = ((LineSeries)(e.VisualItem.Data.Tag)).BorderColor;
                    checkBox.CheckMarkPrimitive.Fill.GradientStyle = Telerik.WinControls.GradientStyles.Solid;
                    checkBox.CheckMarkPrimitive.Border.Visibility = Telerik.WinControls.ElementVisibility.Collapsed;
                }
            }
        }
System.OverflowException: 'Value was either too large or too small for a Decimal.
To reproduce:
var lineSeries = new LineSeries();
lineSeries.DataPoints.Add(new CategoricalDataPoint(0, "A"));
lineSeries.DataPoints.Add(new CategoricalDataPoint(Convert.ToDouble(decimal.MaxValue), "B"));
lineSeries.DataPoints.Add(new CategoricalDataPoint(0, "C"));
lineSeries.DataPoints.Add(new CategoricalDataPoint(decimal.ToDouble(decimal.MaxValue), "D"));
lineSeries.DataPoints.Add(new CategoricalDataPoint(0, "E"));

this.radChartView1.Series.Add(lineSeries);
To Reproduce, make sure to keep the mouse over the trackball text box.
Please use the following code snippet:
public RadForm1()
{
InitializeComponent();
this.radChartView1.View.AreaType = ChartAreaType.Cartesian;
RangeBarSeries rangeBarSeries = new RangeBarSeries();
rangeBarSeries.DataPoints.Add(new RangeDataPoint(DateTime.Now.TimeOfDay.TotalMinutes + 14, DateTime.Now.TimeOfDay.TotalMinutes + 10, "5/17/2021"));
rangeBarSeries.DataPoints.Add(new RangeDataPoint(DateTime.Now.TimeOfDay.TotalMinutes + 7, DateTime.Now.TimeOfDay.TotalMinutes + 5, "5/17/2021"));
rangeBarSeries.DataPoints.Add(new RangeDataPoint(DateTime.Now.TimeOfDay.TotalMinutes + 4, DateTime.Now.TimeOfDay.TotalMinutes + 2, "5/17/2021"));
rangeBarSeries.DataPoints.Add(new RangeDataPoint(DateTime.Now.TimeOfDay.TotalMinutes + 30, DateTime.Now.TimeOfDay.TotalMinutes + 10, "5/18/2021"));
rangeBarSeries.DataPoints.Add(new RangeDataPoint(DateTime.Now.TimeOfDay.TotalMinutes + 7, DateTime.Now.TimeOfDay.TotalMinutes + 5, "5/18/2021"));
rangeBarSeries.DataPoints.Add(new RangeDataPoint(DateTime.Now.TimeOfDay.TotalMinutes + 4, DateTime.Now.TimeOfDay.TotalMinutes + 2, "5/19/2021"));
rangeBarSeries.DataPoints.Add(new RangeDataPoint(DateTime.Now.TimeOfDay.TotalMinutes - 89, DateTime.Now.TimeOfDay.TotalMinutes - 100, "5/20/2021"));
rangeBarSeries.DataPoints.Add(new RangeDataPoint(DateTime.Now.TimeOfDay.TotalMinutes + 7, DateTime.Now.TimeOfDay.TotalMinutes + 5, "5/20/2021"));
rangeBarSeries.DataPoints.Add(new RangeDataPoint(DateTime.Now.TimeOfDay.TotalMinutes - 79, DateTime.Now.TimeOfDay.TotalMinutes - 90, "5/21/2021"));
rangeBarSeries.DataPoints.Add(new RangeDataPoint(DateTime.Now.TimeOfDay.TotalMinutes + 7, DateTime.Now.TimeOfDay.TotalMinutes + 5, "5/21/2021"));
rangeBarSeries.DataPoints.Add(new RangeDataPoint(DateTime.Now.TimeOfDay.TotalMinutes + 14, DateTime.Now.TimeOfDay.TotalMinutes + 10, "5/22/2021"));
rangeBarSeries.DataPoints.Add(new RangeDataPoint(DateTime.Now.TimeOfDay.TotalMinutes + 7, DateTime.Now.TimeOfDay.TotalMinutes + 5, "5/22/2021"));
rangeBarSeries.DataPoints.Add(new RangeDataPoint(DateTime.Now.TimeOfDay.TotalMinutes + 14, DateTime.Now.TimeOfDay.TotalMinutes + 10, "5/23/2021"));
rangeBarSeries.DataPoints.Add(new RangeDataPoint(DateTime.Now.TimeOfDay.TotalMinutes + 7, DateTime.Now.TimeOfDay.TotalMinutes + 5, "5/23/2021"));
rangeBarSeries.DataPoints.Add(new RangeDataPoint(DateTime.Now.TimeOfDay.TotalMinutes + 14, DateTime.Now.TimeOfDay.TotalMinutes + 10, "5/25/2021"));
rangeBarSeries.DataPoints.Add(new RangeDataPoint(DateTime.Now.TimeOfDay.TotalMinutes + 7, DateTime.Now.TimeOfDay.TotalMinutes + 5, "5/24/2021"));
rangeBarSeries.DataPoints.Add(new RangeDataPoint(DateTime.Now.TimeOfDay.TotalMinutes + 14, DateTime.Now.TimeOfDay.TotalMinutes + 10, "5/26/2021"));
rangeBarSeries.DataPoints.Add(new RangeDataPoint(DateTime.Now.TimeOfDay.TotalMinutes + 7, DateTime.Now.TimeOfDay.TotalMinutes + 5, "5/26/2021"));
this.radChartView1.View.Series.Add(rangeBarSeries);
rangeBarSeries.VerticalAxis.LabelRotationAngle = -45;
rangeBarSeries.VerticalAxis.LabelFitMode = AxisLabelFitMode.Rotate;
LinearAxis verticalAxis = this.radChartView1.View.Axes.Get<LinearAxis>(1);
verticalAxis.Minimum = 0; //Minutes 0:00
verticalAxis.Maximum = 1440; //Minutes 23:00
verticalAxis.MajorStep = 60; //60 minutes in an hour
verticalAxis.LastLabelVisibility = AxisLastLabelVisibility.Hidden;
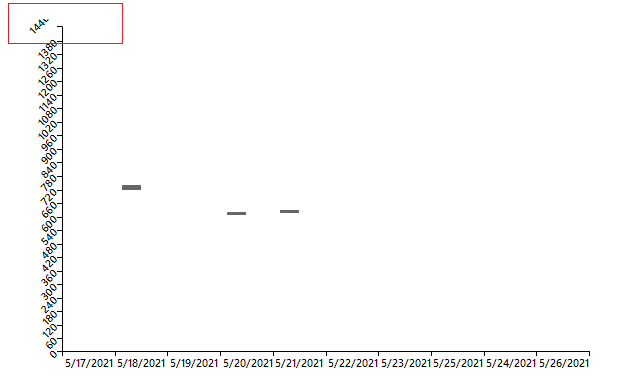
}When the labels are not rotated:
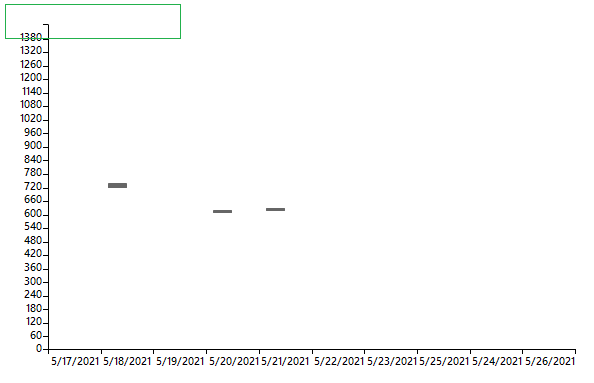
When rotated:
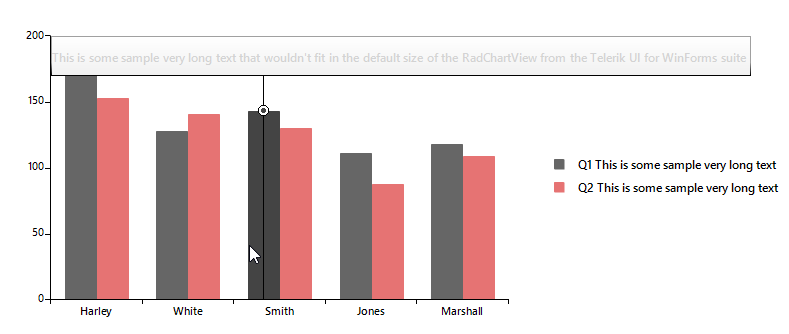
Please use the following code snippet. You will notice that for very long text in the trackball, the fill rectangle doesn't fit the text.
PS. If the legend items occupy enough width of the chart, there wouldn't be sufficient space for the trackball.
        public RadForm1()
        {
            InitializeComponent();

            BarSeries barSeries = new BarSeries("Performance", "RepresentativeName");
            barSeries.LegendTitle = "Q1 This is some sample very long text";
            barSeries.DataPoints.Add(new CategoricalDataPoint(177, "Harley"));
            barSeries.DataPoints.Add(new CategoricalDataPoint(128, "White"));
            barSeries.DataPoints.Add(new CategoricalDataPoint(143, "Smith"));
            barSeries.DataPoints.Add(new CategoricalDataPoint(111, "Jones"));
            barSeries.DataPoints.Add(new CategoricalDataPoint(118, "Marshall"));
            this.radChartView1.Series.Add(barSeries);
            BarSeries barSeries2 = new BarSeries("Performance", "RepresentativeName");
            barSeries2.LegendTitle = "Q2 This is some sample very long text";
            barSeries2.DataPoints.Add(new CategoricalDataPoint(153, "Harley"));
            barSeries2.DataPoints.Add(new CategoricalDataPoint(141, "White"));
            barSeries2.DataPoints.Add(new CategoricalDataPoint(130, "Smith"));
            barSeries2.DataPoints.Add(new CategoricalDataPoint(88, "Jones"));
            barSeries2.DataPoints.Add(new CategoricalDataPoint(109, "Marshall"));
            this.radChartView1.Series.Add(barSeries2);

            this.radChartView1.ShowLegend = true;

            ChartTrackballController trackballController = new ChartTrackballController();
            trackballController.TextNeeded += trackballController_TextNeeded;
            radChartView1.Controllers.Add(trackballController);
        }

        string text = "<html><color=200,200,200,200>This is some sample very long text that wouldn't fit in " +
                      "the default size of the RadChartView from the Telerik UI for WinForms suite</html>";

        private void trackballController_TextNeeded(object sender, TextNeededEventArgs e)
        {
            e.Text = text;
        }
Workaround:
            ChartTrackballController trackballController = new ChartTrackballController();
            trackballController.IsFixedSize = true;
            trackballController.FixedSize = new Size(700, 40);
            trackballController.TextNeeded += trackballController_TextNeeded;
            radChartView1.Controllers.Add(trackballController);