When the data values are all negative, if you create a line graph using kendo chart function, Autoscale on the Y axis is not applied properly. Please check if there is any possible solution.
The two attached figures are normally auto scaled, but the charts that combine the two graphs are not auotoscale normal.
Chart1
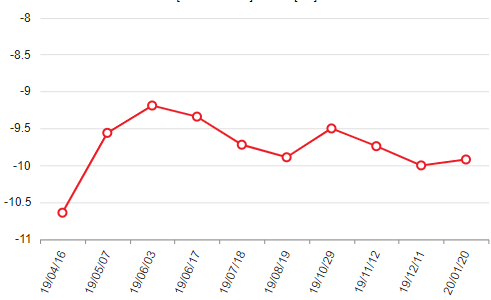
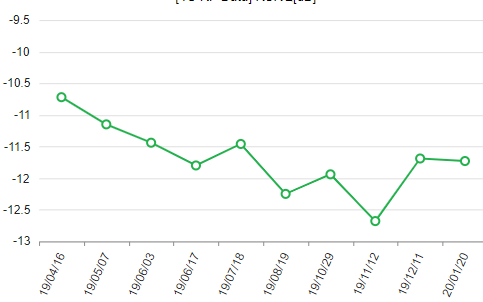
Chart2
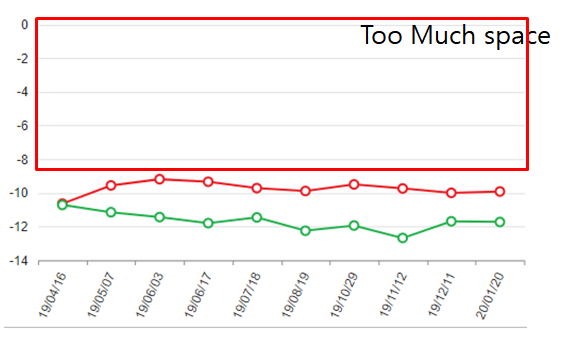
issue chart
Hi,
Closing due to inactivity and lack of samples that illustrate the problem.
Regards,
Angel Petrov
Progress Telerik
Virtual Classroom, the free self-paced technical training that gets you up to speed with Telerik and Kendo UI products quickly just got a fresh new look + new and improved content including a brand new Blazor course! Check it out at https://learn.telerik.com/.
Hi Yun,
I have investigated the provided screenshots and I can confirm that there is a difference in the behavior between the two. However, I have performed several tests locally and the behavior between a single series and multiple is the same. Here is the Dojo sample:
https://dojo.telerik.com/awuyecEw
Could you modify it and let me know the steps needed to replicate the faulty behavior so that I could confirm whether it is a bug?
Regards,
Tsvetomir
Progress Telerik
chart Auto scale
When the data values are all negative, if you create a line graph using kendo chart function, Autoscale on the Y axis is not applied properly. Please check if there is any possible solution.
The two attached figures are normally auto scaled, but the charts that combine the two graphs are not auotoscale normal.
- All
- Completed (2315)
- Declined (1304)
- Duplicated (80)
- In Development (15)
- Need More Info (42)
- Pending Review (3)
- Planned (12)
- Under Review (32)
- Unplanned (1790)
- Won't Fix (9)
- All
- Kendo UI for jQuery
- ActionSheet
- AICodingAssistant
- AIPrompt
- AppBar
- ArcGauge
- AutoComplete
- Avatar
- Badge
- Barcode
- BottomNavigation
- Breadcrumb
- BulletChart
- Button
- ButtonGroup
- Calendar
- Captcha
- Card
- Chart
- Chart Wizard
- Chat
- Checkbox
- CheckBoxGroup
- Chip
- ChipList
- CircularGauge
- CircularProgressBar
- Collapsible
- ColorGradient
- ColorPalette
- ColorPicker
- ComboBox
- ContextMenu
- Data Source
- Date Picker
- DateInput
- DateRangePicker
- DateTimePicker
- Diagram
- Dialog
- DockManager
- Drag and Drop
- Drawer
- Drawing API
- DropDownButton
- DropDownList
- DropDownTree
- Editor
- Effects
- ExpansionPanel
- FileManager
- Filter
- FlatColorPicker
- FloatingActionButton
- Form
- Gantt
- Globalization
- Grid
- Heatmap
- Hierarchical Data Source
- ImageEditor
- InlineAIPrompt
- Licensing
- LinearGauge
- ListBox
- ListView
- Loader
- Map
- MaskedTextBox
- MediaPlayer
- Menu
- MultiColumnComboBox
- MultiSelect
- MultiViewCalendar
- MVVM
- Notification
- NumericTextBox
- OrgChart
- OTP Input
- Pager
- PanelBar
- PDFViewer
- PivotGrid
- PivotGridV2
- Popover
- Popup
- ProgressBar
- PromptBox
- PropertyGrid
- QRCode
- RadialGauge
- RadioButton
- RadioGroup
- RangeSlider
- Rating
- ResponsivePanel
- RippleContainer
- Sankey
- Scheduler
- ScrollView
- SegmentedControl
- Signature
- SkeletonContainer
- Slider
- SmartPasteButton
- Sortable
- SPA
- Sparkline
- SpeechToTextButton
- SplitButton
- Splitter
- Spreadsheet
- Stepper
- StockChart
- Switch
- TabStrip
- TaskBoard
- Templates
- TextArea
- TextBox
- TileLayout
- TimeDurationPicker
- Timeline
- TimePicker
- ToggleButton
- Toolbar
- Tooltip
- Touch
- TreeList
- TreeMap
- TreeView
- Upload
- Validator
- VS Code Extension
- Window
- Wizard