Hello,
I have a problem with KendoPivotGrid auto height while using jQuery 3.5.5.
See Dojo
The same issue was previously in KendoGrid, but now it's solved.
Bug report
PivotGrid has the Include Fields option. When a child field is removed from the pop-up treeview, it is not possible to add it anew since the checkbox is not preserving its state.
Reproduction of the problem
Open the dojo:
https://dojo.telerik.com/@sspasova/oBAloXAp
And follow these steps:
- Click on the callType menu button
- Select Include Fields...
- Expand and Uncheck Low Credit Calls
- Click OK
- The field is successfully removed
- Try the same operations to add it back
- The Low Credit Calls checkbox is already checked ❌
Scenario 2:
1. Open the Demos - https://demos.telerik.com/kendo-ui/pivotgrid/remote-flat-data-binding
2. Click on on the 'Include Fields' option for the Countries. Uncheck some of the countries, for example 'Mexico' and 'UK'.
3. Click the OK button.
Current behavior: All countries are selected again and can not be unchecked.
Expected behavior: The filter should be persisted and previously unchecked countries should remain unchecked.
Environment
- Kendo UI version: 2024.1.130
- jQuery version: 3.4.1
- Browser: [all]
Bug report
The pivot grid does not display the correct value after a series of expand and collapse actions.
Reproduction of the problem
Here are the steps for reproduction:
"Expand column "Mês/Ano"
Expand line "N1"
Expand line "N2" of N1 - "CUSTOS PRODUÇÃO"
Expand line "N3" of N2 - "MATERIA PRIMA"
Please, verify the value of the line N3 "PAPEL OFF SET", at column "09/2020" = ($27,184.00)
Expand line "N3" of N2 - "COMPRA DE IMOBILIZADO"
Expand line "N3" of N2 - "MERCADORIAS"
Expand line "N3" of N2 - "PESSOAL"
Expand line "N3" of N2 - "SERVICOS"
Expand line "N3" of N2 - "MANUTENÇÃO DE MAQUINAS"
Expand line "N2" of N1 - "DESPESAS"
Expand line "N3" of N2 - "PESSOAL"
Expand line "N3" of N2 - "DEDUCOES DA RECEITA"
Expand line "N3" of N2 - "DESPESAS GERAIS"
Expand line "N3" of N2 - "VEICULO"
Expand line "N3" of N2 - "COMPRA DE IMOBILIZADO"
Expand line "N2" of N1 - "CUSTOS VENDA"
Expand line "N3" of N2 - "COMISSOES VENDEDORES"
Expand line "N3" of N2 - "REEMBOLSO"
Expand line "N2" of N1 - "SOCIOS"
Expand line "N3" of N2 - "REEMBOLSO GASTOS SOCIOS"
Expand line "N3" of N2 - "RETIRADA"
Retract line "N1" (with sub-lines "N2" and "N3" still expanded)
Expand line "N2" (with lines "N1" and "N3" still retracted)
Expand line "N3" of N2 - "MATERIA PRIMA"
Expand line "N3" of N2 - "FRETE"
Expand line "N3" of N2 - "PESSOAL"
Expand line "N3" of N2 - "COMPRA DE IMOBILIZADO"
Expand line "N3" of N2 - "DEDUCOES DA RECEITA"
Expand line "N3" of N2 - "DESPESAS GERAIS"
Retract line "N2" (with sub-lines "N3" still expanded)
Expand line "N1"
Retract line "N2" - "SOCIOS" (with sub-lines "N3" still expanded)
Retract line "N2" - "CUSTOS VENDA" (with sub-lines "N3" still expanded)
Retract line "N1" (with sub-lines "N2" and "N3" still expanded)
Expand line "N3" (with lines "N1" and "N2" still retracted)
Retract line "N3"
Expand line "N1"
Expand line "N3" of N2 - "FRETE"
Expand line "N3" of N1 - "CUSTOS VENDA" (with sub-lines "N2" still retracted)
Expand line "N3" of N1 - "SOCIOS" (with sub-lines "N2" still retracted)
Retract line "N1" (with sub-lines "N2" and "N3" still expanded)
Expand line "N3" (with lines "N1" and "N2" still retracted)
Please, verify the value of the line N3 - "PAPEL OFF SET" = ($9,069.50) - That's incorrect. It still should be ($27,184.00)"
The PivotConfigurator is very static. It would be nice to change the layout.

For example some options:
- Hide / visibility of all four elements (Row, Column, Measure, Fieldlist)
- Position of all four elements (Row, Column, Measure, Fieldlist)
Currently the Pivot Grid have both Column and Row that will be used to be on display for Jquery type.

Please add in additional Filter like others software givers on pivotgrid.
This additional Filter is not used for display, as it is used for filter only.
Hi Team,

I am working on one of client application and we are using pivot grid control jQuery version to connect and pull data from cube but one things which we are missing is getting the cellset properties(back_color) from cube data.

There are certain business rules applied on the cube to show data with different color schemes. Now based on the cube data color properties , We want to get that as a part of kendo UI pivot grid for the cells.


We saw excel supports that feature, where it can understand the cell set (back color) properties and render the back color. I am also attaching snapshots from excel.

Below is the sample mdx query and highlighted underlined holds cell properties


SELECT NON EMPTY { [Measures].[QCV to Deploy], [Measures].[Initial Calculated Quota], [Measures].[Quota Deployed], [Measures].[Remaining QCV] }

ON COLUMNS, NON EMPTY { ([SalesMetric].[Sales Metric Key].[Sales Metric Key].ALLMEMBERS * [SalesMetric].[Sales Metric Name].[Sales Metric Name].ALLMEMBERS ) }

DIMENSION PROPERTIES MEMBER_CAPTION ON ROWS FROM (

SELECT ( { [SalesOrganization].[SalesOrganization].[All], [SalesOrganization].[SalesOrganization].&[108]} )

ON COLUMNS FROM [QuotaAllocation]) WHERE ( [SalesOrganization].[SalesOrganization].CurrentMember )

CELLPROPERTIES VALUE, BACK_COLOR, FORE_COLOR, FORMATTED_VALUE, FORMAT_STRING, FONT_NAME, FONT_SIZE, FONT_FLAGS
I've bound the PivotGrid to a XMLA-WebService (with Mondrian as Backend).
In the Datasource I've defined the error-Function.
When PivotGrid requests Data and Mondrian runs an Exception, following XMLA is transferred:
<?xml version="1.0" encoding="ISO-8859-1"?>
<SOAP-ENV:Envelope xmlns:SOAP-ENV="http://schemas.xmlsoap.org/soap/envelope/" SOAP-ENV:encodingStyle="http://schemas.xmlsoap.org/soap/encoding/" >
<SOAP-ENV:Header>
</SOAP-ENV:Header>
<SOAP-ENV:Body>
<SOAP-ENV:Fault>
<faultcode>SOAP-ENV:Server.00HSBE02</faultcode>
<faultstring>XMLA Discover unparse results error</faultstring>
<faultactor>Mondrian</faultactor>
<detail>
<XA:error xmlns:XA="http://mondrian.sourceforge.net">
<code>00HSBE02</code>
<desc>The Mondrian XML: Error in executeQuery. Stackdump follows. See SQL logfile for more info. Error Stack Dump, time : 22.11.2018 13:19:16 com.microsoft.sqlserver.jdbc.SQLServerException: Die Sachbearbeiter-Spalte wurde für 'Beschluss' mehrmals angegeben. 	at com.microsoft.sqlserver.jdbc.SQLServerException.makeFromDatabaseError(SQLServerException.java:216) 	at com.microsoft.sqlserver.jdbc.SQLServerStatement.getNextResult(SQLServerStatement.java:1515) 	at com.microsoft.sqlserver.jdbc.SQLServerStatement.doExecuteCursored(SQLServerStatement.java:1879) 	at com.microsoft.sqlserver.jdbc.SQLServerStatement.doExecuteStatement(SQLServerStatement.java:766) 	at com.microsoft.sqlserver.jdbc.SQLServerStatement$StmtExecCmd.doExecute(SQLServerStatement.java:689) 	at com.microsoft.sqlserver.jdbc.TDSCommand.execute(IOBuffer.java:5696) 	at com.microsoft.sqlserver.jdbc.SQLServerConnection.executeCommand(SQLServerConnection.java:1715) 	at com.microsoft.sqlserver.jdbc.SQLServerStatement.executeCommand(SQLServerStatement.java:180) 	at com.microsoft.sqlserver.jdbc.SQLServerStatement.executeStatement(SQLServerStatement.java:155) 	at com.microsoft.sqlserver.jdbc.SQLServerStatement.executeQuery(SQLServerStatement.java:616) 	at net.abit.base.support.StatementImpl.executeQuery(StatementImpl.java:504) 	at mondrian.rolap.SqlStatement.execute(SqlStatement.java:201) 	at mondrian.rolap.RolapUtil.executeQuery(RolapUtil.java:350) 	at mondrian.rolap.RolapUtil.executeQuery(RolapUtil.java:303) 	at mondrian.rolap.SqlMemberSource.getMemberCount(SqlMemberSource.java:149) 	at mondrian.rolap.SqlMemberSource.getLevelMemberCount(SqlMemberSource.java:142) 	at mondrian.rolap.SmartMemberReader.getLevelMemberCount(SmartMemberReader.java:158) 	at mondrian.rolap.RolapSchemaReader.getLevelCardinality(RolapSchemaReader.java:320) 	at sun.reflect.NativeMethodAccessorImpl.invoke0(Native Method) 	at sun.reflect.NativeMethodAccessorImpl.invoke(NativeMethodAccessorImpl.java:62) 	at sun.reflect.DelegatingMethodAccessorImpl.invoke(DelegatingMethodAccessorImpl.java:43) 	at java.lang.reflect.Method.invoke(Method.java:498) 	at mondrian.rolap.RolapUtil$2.invoke(RolapUtil.java:111) 	at com.sun.proxy.$Proxy33.getLevelCardinality(Unknown Source) 	at mondrian.olap4j.MondrianOlap4jExtra.getLevelCardinality(MondrianOlap4jExtra.java:74) 	at mondrian.xmla.RowsetDefinition$MdschemaDimensionsRowset.populateDimension(RowsetDefinition.java:3970) 	at mondrian.xmla.RowsetDefinition$MdschemaDimensionsRowset.populateCube(RowsetDefinition.java:3915) 	at mondrian.xmla.RowsetDefinition$MdschemaDimensionsRowset.populateCatalog(RowsetDefinition.java:3897) 	at mondrian.xmla.RowsetDefinition$MdschemaDimensionsRowset.populateImpl(RowsetDefinition.java:3885) 	at mondrian.xmla.Rowset.populate(Rowset.java:201) 	at mondrian.xmla.Rowset.unparse(Rowset.java:173) 	at mondrian.xmla.XmlaHandler.discover(XmlaHandler.java:2903) 	at mondrian.xmla.XmlaHandler.process(XmlaHandler.java:676) 	at mondrian.xmla.impl.DefaultXmlaServlet.handleSoapBody(DefaultXmlaServlet.java:517) 	at mondrian.xmla.XmlaServlet.doPost(XmlaServlet.java:318) 	at javax.servlet.http.HttpServlet.service(HttpServlet.java:660) 	at javax.servlet.http.HttpServlet.service(HttpServlet.java:741) 	at org.apache.catalina.core.ApplicationFilterChain.internalDoFilter(ApplicationFilterChain.java:231) 	at org.apache.catalina.core.ApplicationFilterChain.doFilter(ApplicationFilterChain.java:166) 	at org.apache.tomcat.websocket.server.WsFilter.doFilter(WsFilter.java:53) 	at org.apache.catalina.core.ApplicationFilterChain.internalDoFilter(ApplicationFilterChain.java:193) 	at org.apache.catalina.core.ApplicationFilterChain.doFilter(ApplicationFilterChain.java:166) 	at org.apache.catalina.core.StandardWrapperValve.invoke(StandardWrapperValve.java:199) 	at org.apache.catalina.core.StandardContextValve.invoke(StandardContextValve.java:96) 	at org.apache.catalina.core.StandardHostValve.invoke(StandardHostValve.java:140) 	at org.apache.catalina.valves.ErrorReportValve.invoke(ErrorReportValve.java:80) 	at org.apache.catalina.valves.AbstractAccessLogValve.invoke(AbstractAccessLogValve.java:651) 	at org.apache.catalina.core.StandardEngineValve.invoke(StandardEngineValve.java:87) 	at org.apache.catalina.connector.CoyoteAdapter.service(CoyoteAdapter.java:342) 	at org.apache.coyote.http11.Http11Processor.service(Http11Processor.java:498) 	at org.apache.coyote.AbstractProcessorLight.process(AbstractProcessorLight.java:66) 	at org.apache.coyote.AbstractProtocol$ConnectionHandler.process(AbstractProtocol.java:796) 	at org.apache.tomcat.util.net.NioEndpoint$SocketProcessor.doRun(NioEndpoint.java:1374) 	at org.apache.tomcat.util.net.SocketProcessorBase.run(SocketProcessorBase.java:49) 	at java.util.concurrent.ThreadPoolExecutor.runWorker(ThreadPoolExecutor.java:1149) 	at java.util.concurrent.ThreadPoolExecutor$Worker.run(ThreadPoolExecutor.java:624) 	at org.apache.tomcat.util.threads.TaskThread$WrappingRunnable.run(TaskThread.java:61) 	at java.lang.Thread.run(Thread.java:748) </desc>
</XA:error>
</detail>
</SOAP-ENV:Fault>
</SOAP-ENV:Body>
</SOAP-ENV:Envelope>
in Result the error-Parameter contains:
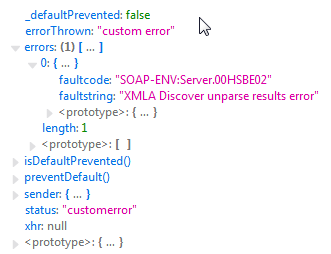
As you can see, the Details are missing. This wouldn't be worse - but additional xhr is away (null) - so manually parsing the result is impossible.
It should be possible to use message details - or having access to the complete Response (but xhr is not present).
In SSAS world you can often see mega cubes with many measures and dimensions. Currently Kendo pivot grid configurator does not show measure groups and therefore there is no way to filter dimensions and filters that belong to a specific measure group.
Add format configuration for Pivot schema rows and columns. Like aggregates config.
Connection with Azure Analysis Services not work.
If i have a hierarchy location, for example country, city and postal code, i can only use location as field and can't use country, city or postal code. If i want to use them indiviually i would have to configure them as extra attributes in the olap schema.

It would be nice, if these hierarchies could be used as fields.
In the .NET for Ajax PivotGrid, you can set a caption for all fields, row and column. This does not seem possible in the kendo based version (MVC). The only property I see on a column or row is if we want it expanded by default or not.

Here is how it is done on the Webforms version of the control

 <Fields>
                <telerik:PivotGridRowField DataField="Rep" ZoneIndex="1" Caption="Rep"
                </telerik:PivotGridRowField>
In some applications one may not want aggregation on some or all dimenions on the pivot grid and jut show the raw data.
As per this post: http://www.telerik.com/forums/pivotgrid-bug

When using PivotGrid with a flat data source the handles for dragging the dimensions are labelled with a different string to the dimension headers.

The dimension headers are labelled with the dataSource.schema.cube.dimensions.[name].caption.

The dimension drag handles are labelled with the dataSource.rows.name (or dataSource.columns.name).

Now, the dataSource.rows.name must be the key in the dataSource.schema.cube.dimensions of the dimension and this must also be a key in each item in the data array -- the field that stores the value of the dimension -- and therefore is in general not suitable for showing to users.

In any case, it seems to me to be a bug that the drag handle is labelled with a different string to the dimension caption.
Currently measures are displayed as dimensions and there is no visual difference  between them.
I suggest you showing measures as a very first item in the pivot grid configurator. Also please use a  meaningful icon for this item.
It would be nice to have a chart chooser for the PivotGrid build in (a dropdown that i can place anywhere). At the moment it is really difficult to display a PivotGrid in a chart or even change the chart type on the fly. This and the convertion to a chart could be build in so every developer don't need to worry about this.

What i visualize is a dropdown menu which shows all posible chart types. If i choose one, the pivot grid disapears and on it's position the choosen chart apears (optional with the PivotConfigurator in the side). From a chart i can switch back to the pivot grid or choose another chart type.
An OData feed that supports 'OData Extension for Data Aggregation Version 4.0'
can be queried for all of the information required to populate a PivotGrid
with rows and columns that are paged, sortable (including by different aggregates
of the measures), and filterable, and have all calculations performed on the server.

The pivot grid can be popualted using data obtained from a couple of requests
to a suitable feed -- or feeds.

Suppose we have an OData feed that we'd like to display in a pivot grid. Some of the
columns in the feed will become dimensions, and some will become measures.
(We may display the same measure more than once, with different aggregates applied.)

In order to display the row/column headings for the pivotGrid we need to select the
distinct values from the 'dimension' columns. The filtering provided by OData
allows the row/column headings to be filtered, and even
paged (in both directions). Sorting is more difficult because we want to sort not only
by the row/column heading values themselves, but also by (aggregates of) the measures.
However, that's a problem for the server side!

In order to populate the body of the table we need to calculate a load of aggregates
from the measure columns in the base dataset for the rows that correspond to visible
row/column headers. We can write a rather long OData $filter expression to obtain
the required rows from the original OData feed, and then aggregate them.

All of this functionality is available in 'OData Extension for Data Aggregation Version 4.0'.
However, as an interim solution we may establish two 'helper' OData feeds associated
with the original feed: one for the dimensions for populating the row and column headers,
and one for the measures to populate the body of the table. The grid has already
established a convention for asking for aggregates computed on the server,
although this can be overridden using parameterMap anyway.
Make the COUNT measure count only distinct itens on PivotGrid. For instance, let's say we have a dataSource like this:
var dados = [{ PersonID: 2958, Address: "5h St"},{ PersonID: 2958, Address: "Lexington Ave"},{ PersonID: 2958, Address: "76th Street"}]
Note that it is only 1 person, which has 3 address.. if I wanted to use the COUNT measure on the Address, it is correct (it counts 3 itens). But when I use the COUNT measure on the PersonID, it also counts 3 itens, but there is only one personID. I think it should count distinct values for the data in the measure.
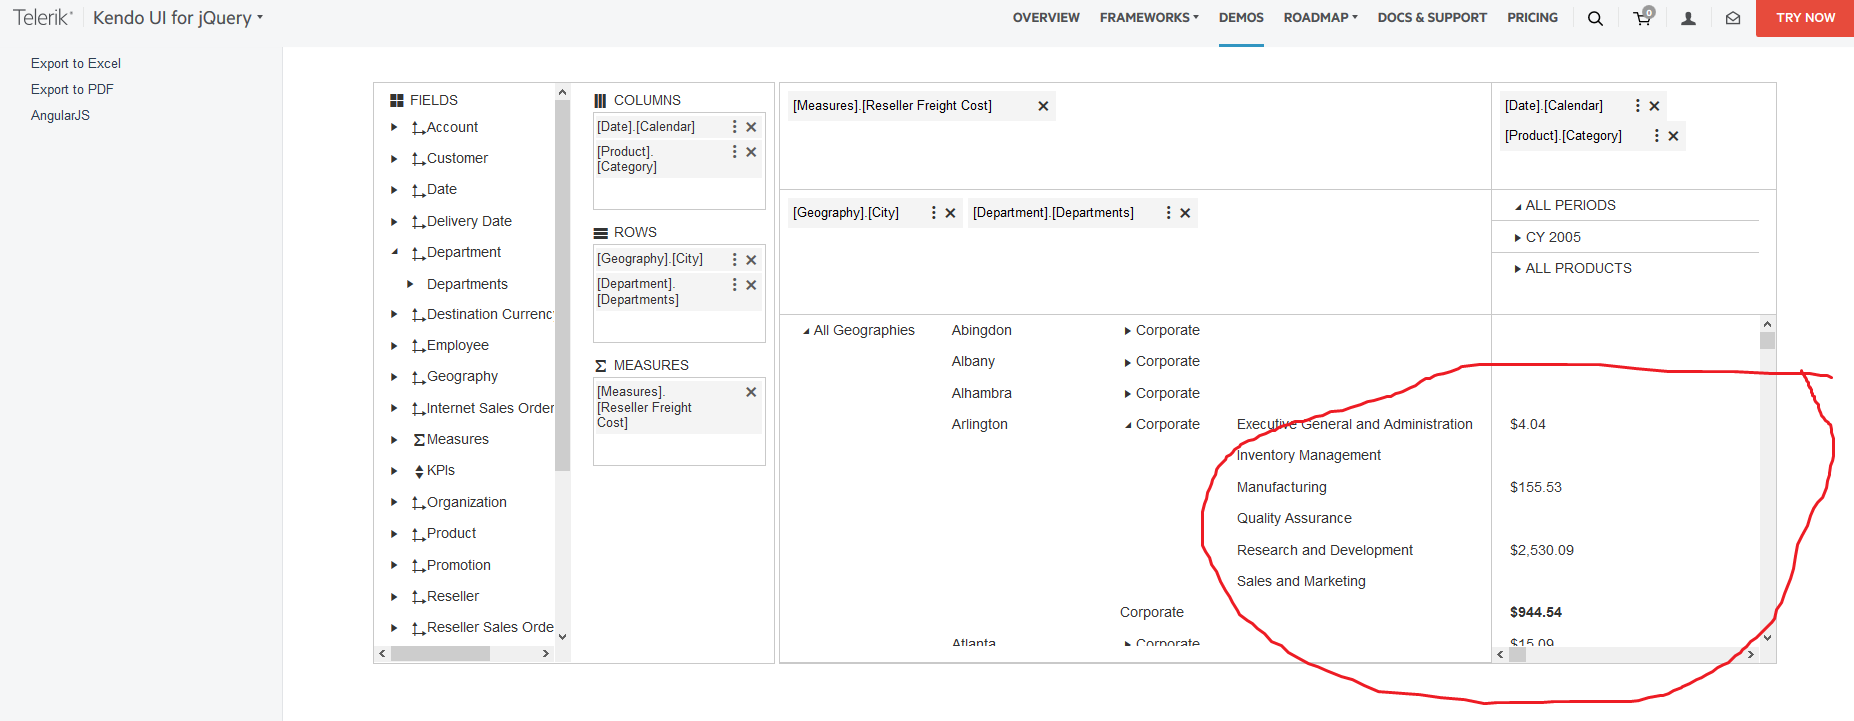
On a screen, showing the totals to the left and bottom of the data it summarizes makes no sense.

When a user drills through a data set, the totals are the deciding factors for which nodes to expand.