Please provide a property that will enable the ValueAxis of Radar Chart to be visible on top of the RadarArea series.
Currently, if the RadarArea Series has the opacity property set to 1.0, it masks the ValueAxis. To make the ValueAxis visible, the RadarArea's opacity should be reduced and this in turn makes the color of RadarArea less appealing.
Please provide a feature whereby we can make the ValueAxis visible through the RadarArea series without compromising on the opacity.
Thank you for sharing that with the Kendo UI community. I can see that a lot of thought and care has gone into adding the gridlines on top.
Kind Regards,
Alex Hajigeorgieva
Progress Telerik
Sure Alex.
The idea is to attach a dataBound event to the Chart object.
In this dataBound event, invoke the functionality to render gridlines.
Ensure that the opacity of the series matches the opacity defined in the gridLineShow().
The dataBound event gets fired when a data is bound to the Chart as in:
This should render the chart as in the attached "Chart with GridLines.jpg" attachment. We prefer subtle gridlines, so used rgba(0, 0, 0, 0.1).
If you want gridlines to render bolder lines, use rgb(0,0,0) so it will render as in "GridLines2.jpg"
I have shared the solution in the below link:
https://stackblitz.com/edit/qnruem-lr5ffp
Best regards
Anuradha
Thank you for letting us know.
It would be fantastic if you share the workaround that met your expectations for now with the Kendo UI community while this feature request is still waiting to gain popularity.
Thank you very much in advance.
Kind Regards,
Alex Hajigeorgieva
Progress Telerik
Hi Alex,
We have developed a workaround for this case wherein we are manually rendering the grid-lines on top of the chart area.
Since our objective is primarily achieved, we would prefer to wait for a release from Telerik as per your development cycle and implement the solution when it is released.
Thanks for your time.
Best regards
Anuradha
Hi Alex,
We are discussing on this and will get back to you once we have reached a decision.
Regards
Anuradha
The Professional Services department gathers a team that takes on the task at hand, in this case a Feature Acceleration. They estimate the resources and timeframe necessary to deliver the finished result as soon as possible and will be able to give you a quote precisely of time and cost.
If you like, I can get a colleague from that department to get in touch with you with an estimate.
Kind Regards,
Alex Hajigeorgieva
Progress Telerik
Thank you so much for the follow-up and contribution towards the votes.
Yes, this feature does add value for our client. We would also like to know if there is an additional cost involved in the Feature Acceleration Program. Please do update us.
We highly appreciate all your efforts towards multiple alternative solutions and suggestions, Alex.
Best regards
Anuradha
Thank you for the shared forum thread and further explanations regarding the feature.
I have added one more vote to this feature request on behalf of the customer who posted the forum thread in 2013.
If this feature request gains popularity, it will definitely be considered for future implementation. However, if the availability of this feature is important for the success of the project that you are working on, you could consider our Feature Acceleration Programme instead. This is a separate offering whereby clients are able to negotiate a feature to become available sooner than planned.
If you are interested in checking out such possibility, I can get someone from that department to contact you. Let me know if you would like that.
Kind Regards,
Alex Hajigeorgieva
Progress Telerik
Thank you, Alex for the time taken to provide workarounds. My client is keen on having the gridlines visible and feels it adds more value, which is why we wanted to raise this feature request. We wanted to have a checkbox in the user interface that would enable toggling the gridlines on and off once this feature was made available for added flexibility.
We have also noticed that this feature was being anticipated by other developers for a few years now (since 2013). Please refer below forum where this has been discussed.
https://www.telerik.com/forums/show-radar-chart-grid-through-area-or-lines
While you may choose not to make this a default property that should be enabled by default, this feature could just be a switch to turn on for those who want the gridlines visible. We feel it adds more value if this flexibility is provided.
Regards
Anuradha
If you wish to have both the valueAxis and the grid likes black, then add the axisDefaults.majorGridLines.color configuration:
axisDefaults:{ majorGridLines:{ color:"black" },},As far as placing the chart series underneath them, this is not something that is available or planned. The team which develops the charts engines does not have enough evidence to understand any value that such addition adds and it is believed that it would lead to poorer UX.
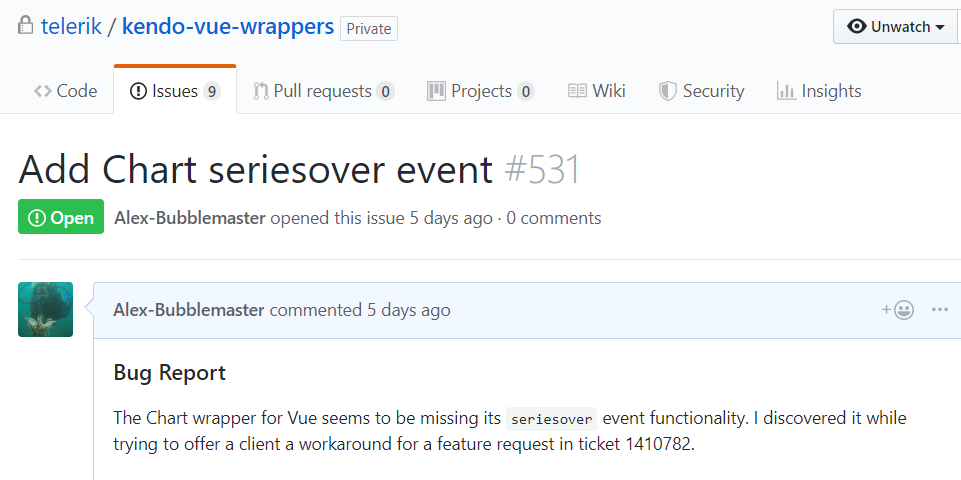
An alternative would be to change the opacity on seriesOver event to the currently hovered series. Unfortunately, the seriesOver event is missing from the Vue suite and I have added an issue in our private repository 5 days ago:
This is what it looks like with jQuery:
https://dojo.telerik.com/@bubblemaster/opIcOxix/2
So as an alternative, you can use the seriesClick event for Vue instead:
https://www.telerik.com/kendo-vue-ui/components/charts/api/chart/Chart/#toc-seriesclick
Kind Regards,
Alex Hajigeorgieva
Progress Telerik
Thanks Alex, for your inputs.
However I use a radarArea and not radarLine. My issue like I mentioned in the original request, because the opacity of radarArea is 1.0, the LineAxis and MajorGridlines were not visible.
I want the MajorGridLines of both CategoryAxis as well as ValueAxis for this requirement to work.
- Please check attachment "Chart1.jpg". This is the basic chart with the gridLines when the series is not plotted. This is achieved by setting the MajorGridLines of both the ValueAxis and CategoryAxis.
- Now check "Chart2.jpg". This is how the chart gets rendered at the moment. We must get the GridLines over the RadarArea.
Thanks to your solution, now I get the valueAxis visible. It would be great to have the gridlines working in this way as well.
Please use this code:
SeriesDefaults:
ValueAxis:
CategoryAxis:
Much appreciate your time and support.
Regards
Anuradha
The zIndex works in exactly the same way for the Vue.js wrappers, there is no need to translate it:
<kendo-chart :title-text="'Kendo Chart Example'" :series="series" :series-defaults="seriesDefaults" :value-axis="valueAxis"</kendo-chart> new Vue({ el: "#vueapp", data: function() { return { valueAxis: { zIndex:1 } }})The majorGridLines of the categoryAxis are visible by default, they provide the spiderweb look:
https://docs.telerik.com/kendo-ui/api/javascript/dataviz/ui/chart/configuration/categoryaxis.majorgridlines#categoryaxismajorgridlinesvisible
The image referenced here resembles series type radarLine. Here is a runnable Kendo UI RadaLine Chart in a Vue.js application. Let me know if there is anything that you would like different than the provided demo. It seems to me that it has all that is pictured in the image:
https://stackblitz.com/edit/qnruem
- the majorGridLines are visible
- the categories are visible
- the type is radarLine
- the valueAxis has a higher zIndex than the series

Look forward to hearing back from you.
Kind Regards,
Alex Hajigeorgieva
Progress Telerik
Thanks Alex,
While your example works for jQuery Chart, I am unable to translate into VueJS.
1. How to get the zIndex working in VueJS?
2. How do I get the gridlines visible? (Please refer attachment.) We also want the grildlines (resembline spiderweb in the picture) to be visible.
Please advise. Appreciate your time.
Regards
Anuradha
The Kendo UI Chart valueAxis already has the capability to be drawn on top of the area, however this property is not documented as it is used internally - as part of the private chart API.
Could you try the following and let us know if it helps in your scenario:
valueAxis: { zIndex:1, /* other config */}https://dojo.telerik.com/@bubblemaster/ohaRoXOz
Kind Regards,
Alex Hajigeorgieva
Progress Telerik
Request this ValueAxis feature along with the base gridlines to be available when rendered. Please refer attachment.
I want the gridlines also to overlay the RadarArea series when rendered.
- All
- Completed (2313)
- Declined (1304)
- Duplicated (80)
- In Development (17)
- Need More Info (42)
- Pending Review (4)
- Planned (11)
- Under Review (31)
- Unplanned (1788)
- Won't Fix (9)
- All
- Kendo UI for jQuery
- ActionSheet
- AICodingAssistant
- AIPrompt
- AppBar
- ArcGauge
- AutoComplete
- Avatar
- Badge
- Barcode
- BottomNavigation
- Breadcrumb
- BulletChart
- Button
- ButtonGroup
- Calendar
- Captcha
- Card
- Chart
- Chart Wizard
- Chat
- Checkbox
- CheckBoxGroup
- Chip
- ChipList
- CircularGauge
- CircularProgressBar
- Collapsible
- ColorGradient
- ColorPalette
- ColorPicker
- ComboBox
- ContextMenu
- Data Source
- Date Picker
- DateInput
- DateRangePicker
- DateTimePicker
- Diagram
- Dialog
- DockManager
- Drag and Drop
- Drawer
- Drawing API
- DropDownButton
- DropDownList
- DropDownTree
- Editor
- Effects
- ExpansionPanel
- FileManager
- Filter
- FlatColorPicker
- FloatingActionButton
- Form
- Gantt
- Globalization
- Grid
- Heatmap
- Hierarchical Data Source
- ImageEditor
- InlineAIPrompt
- Licensing
- LinearGauge
- ListBox
- ListView
- Loader
- Map
- MaskedTextBox
- MediaPlayer
- Menu
- MultiColumnComboBox
- MultiSelect
- MultiViewCalendar
- MVVM
- Notification
- NumericTextBox
- OrgChart
- OTP Input
- Pager
- PanelBar
- PDFViewer
- PivotGrid
- PivotGridV2
- Popover
- Popup
- ProgressBar
- PromptBox
- PropertyGrid
- QRCode
- RadialGauge
- RadioButton
- RadioGroup
- RangeSlider
- Rating
- ResponsivePanel
- RippleContainer
- Sankey
- Scheduler
- ScrollView
- SegmentedControl
- Signature
- SkeletonContainer
- Slider
- SmartPasteButton
- Sortable
- SPA
- Sparkline
- SpeechToTextButton
- SplitButton
- Splitter
- Spreadsheet
- Stepper
- StockChart
- Switch
- TabStrip
- TaskBoard
- Templates
- TextArea
- TextBox
- TileLayout
- TimeDurationPicker
- Timeline
- TimePicker
- ToggleButton
- Toolbar
- Tooltip
- Touch
- TreeList
- TreeMap
- TreeView
- Upload
- Validator
- VS Code Extension
- Window
- Wizard