Completed
Last Updated:
29 Sep 2020 12:26
by ADMIN
Imported User
Created on:
04 Nov 2016 17:58
Category:
Gantt
Type:
Feature Request
Support for Actual and Planned Comparison in Gantt Chart
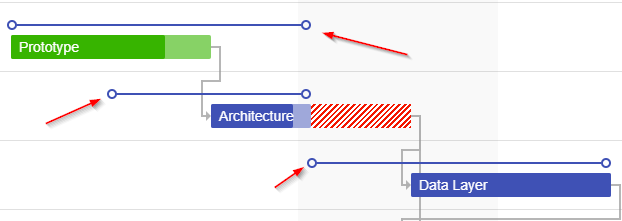
Most of the time project managers would like to compare planned start & end dates vs actual start and end dates in gantt view. This feature is not supported by current Gantt chart. What I'm envisioning is something similar to the implementation of Gantt chart by Fusion Charts. (http://www.fusioncharts.com/charts/gantt-charts/). Displaying delays in actual task compared to plan would be an an added advantage. This feature may be implemented using a task template, but it's nice to have feature in the control.
12 comments
ADMIN
Carl
Posted on:
29 Sep 2020 12:26
Kasim
Posted on:
29 Sep 2020 04:45
ADMIN
Carl
Posted on:
28 Sep 2020 19:39
Kasim
Posted on:
20 Sep 2020 04:29
ADMIN
Carl
Posted on:
17 Sep 2020 18:01
Kasim
Posted on:
10 Dec 2019 09:47
Murtadha
Posted on:
15 Oct 2019 15:18
Ramya
Posted on:
28 Sep 2018 14:37
Imported User
Posted on:
11 Jun 2018 21:31
Imported User
Posted on:
10 Jun 2018 13:02
Imported User
Posted on:
10 Jun 2018 12:16
Stefan
Posted on:
11 Feb 2018 10:03

