Declined
Last Updated: 19 Sep 2022 08:41 by ADMIN
n/a
Created on: 15 Jul 2022 20:14
Category: UI for WPF
Type: Bug Report
0
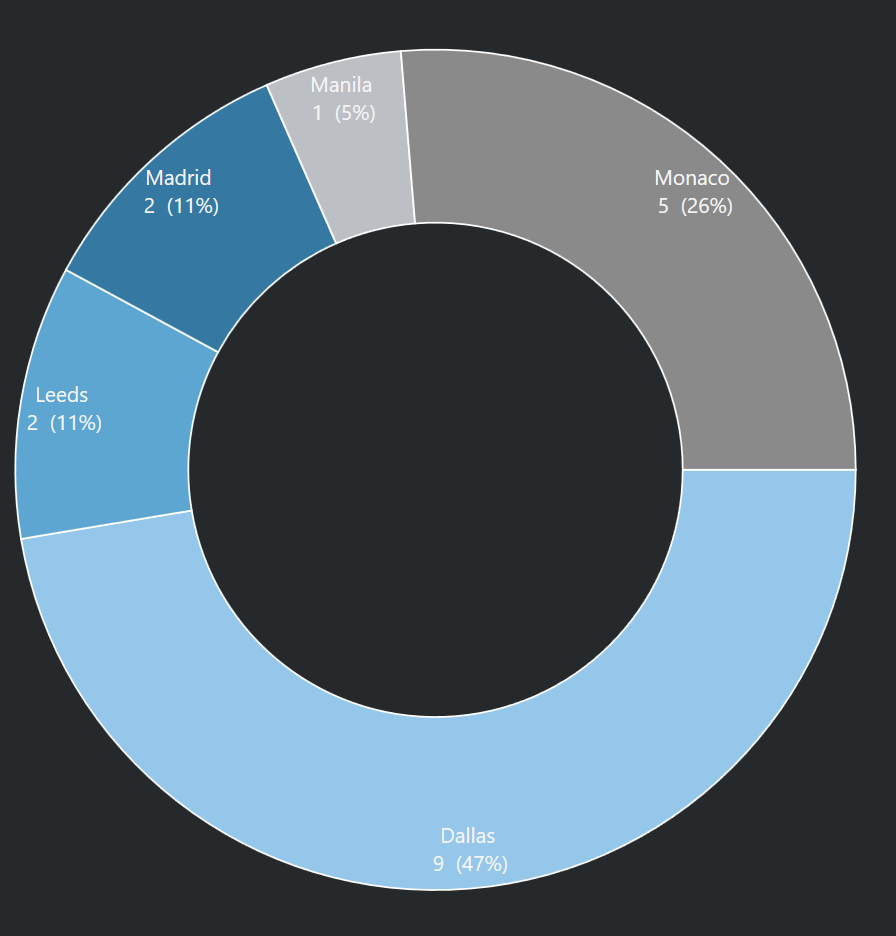
Percent in PieChart Series doesn't update

I have a Pie chart like this:


                 <telerik:RadPieChart Palette="Arctic">                    
                        <telerik:DoughnutSeries ItemsSource="{Binding GraphedStatistics, Mode=OneTime}" ValueBinding="Previous" ShowLabels="True">
                            <telerik:DoughnutSeries.LabelDefinitions>
                                <telerik:ChartSeriesLabelDefinition>
                                    <telerik:ChartSeriesLabelDefinition.Template>
                                        <DataTemplate>
                                             <StackPanel Opacity="{Binding Value, Mode=OneWay>
                                                <TextBlock Text="{Binding DataItem.Name}" HorizontalAlignment="Center" Foreground="{StaticResource textBlockForeground}"/>
                                                <TextBlock  HorizontalAlignment="Center"  Foreground="{StaticResource textBlockForeground}">
                                                    <Run Text="{Binding Value, Mode=OneWay, StringFormat=' {0:#}'}"/>
                                                    <Run Text="{Binding Percent, Mode=OneWay, StringFormat=' ({0:#}%)'}"/>
                                                </TextBlock>
                                            </StackPanel>
                                        </DataTemplate>
                                    </telerik:ChartSeriesLabelDefinition.Template>
                                </telerik:ChartSeriesLabelDefinition>
                            </telerik:DoughnutSeries.LabelDefinitions>
                        </telerik:DoughnutSeries>


If I generate a pie or doughnut chart the Percent is not updated when I update a value in the bound data source (GraphedStatistics).  Note: I am updating the observable collection not replacing it. The graph is redrawn correctly and Value updates correctly.

The version is 22.1.1.0 (not in the options below)


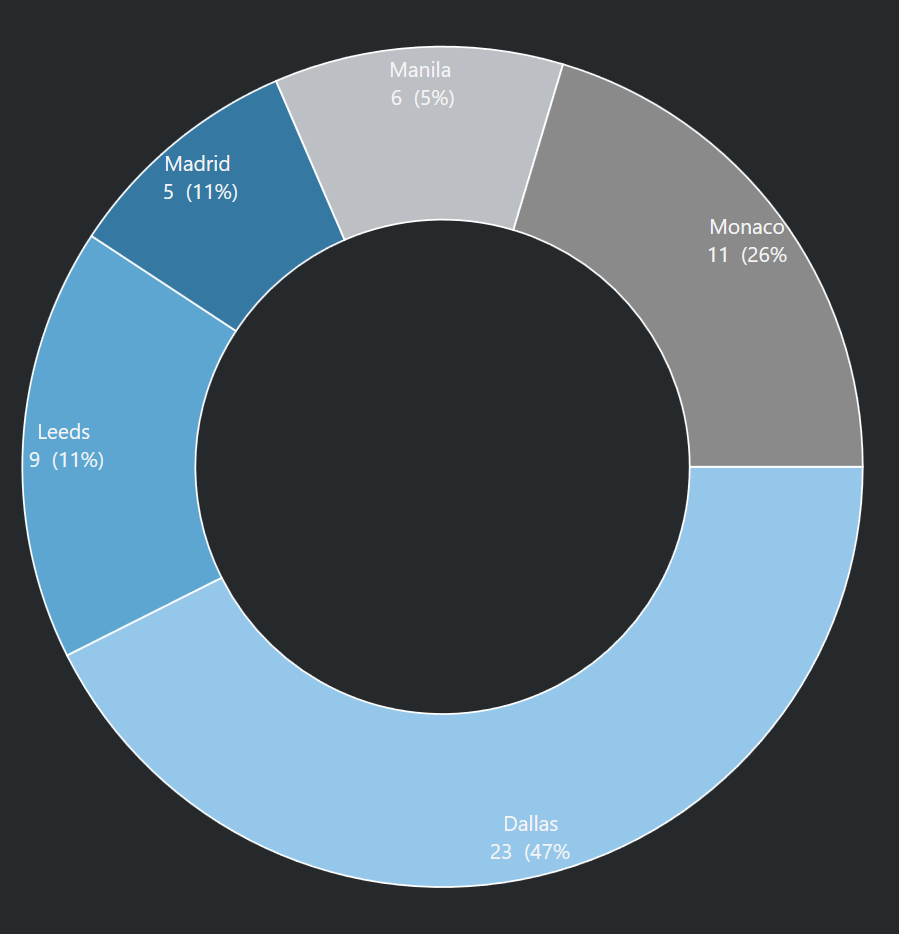
Updated (See that 'Monaco' is the same percentage as before the update,  Value is correct and the UI Graph is correct but the segment is clearly not 26%)


2 comments
ADMIN
Stenly
Posted on: 19 Sep 2022 08:41

Hello Simon,

We have further investigated this matter and have decided to set the status of this bug report to Declined. The reason for this is that the suggested way to display percentages in the RadPieChart is by including an additional ChartSeriesLabelDefinition instance to the LabelDefinitions collection, rather than binding to the Percent property. This way, the percentage of each data point object will be displayed and its value will be updated accordingly.

I hope the provided information will be of help to you. Please let us know if we could be of any further help regarding this case.

Regards,
Stenly
Progress Telerik

Virtual Classroom, the free self-paced technical training that gets you up to speed with Telerik and Kendo UI products quickly just got a fresh new look + new and improved content including a brand new Blazor course! Check it out at https://learn.telerik.com/.

ADMIN
Stenly
Posted on: 22 Jul 2022 11:08

Hello Simon,

In order for the UI to be updated, the property set to the ValueBinding property of the DoughnutSeries series has to notify the UI that its value has been updated. This is done by implementing the INotifyPropertyChanged interface in the class, which contains this property, and then by raising the PropertyChanged event handler.

The following code snippets show this suggestion's implementation:

//Sample data model class

publicclassDataInfo : INotifyPropertyChanged { privateintvalue; publicint Value { get { return this.value;
} set { this.value = value; this.OnPropertyChanged(nameof(this.Value)); } } publicstring Name { get; set; } public event PropertyChangedEventHandler? PropertyChanged; protected void OnPropertyChanged([CallerMemberName] string name = null) { PropertyChanged?.Invoke(this, new PropertyChangedEventArgs(name)); } }

The view model's logic:

public class MainViewModel
{
    public MainViewModel()
    {
        this.DataInfos = new ObservableCollection<DataInfo>()
        {
            new DataInfo{ Value = 1, Name = "Manila" },
            new DataInfo{ Value = 2, Name = "Madrid" },
            new DataInfo{ Value = 2, Name = "Leeds" },
            new DataInfo{ Value = 5, Name = "Monaco" },
            new DataInfo{ Value = 9, Name = "Dallas" },
        };
    }

    public ObservableCollection<DataInfo> DataInfos { get; set; }
}

When the Monaco DataInfo's Value property is changed, the following result is present:

With this said, I have also attached a sample project for you to test.

Regards,
Stenly
Progress Telerik

Love the Telerik and Kendo UI products and believe more people should try them? Invite a fellow developer to become a Progress customer and each of you can get a $50 Amazon gift voucher.

Attached Files: