The AM/PM value is not shown in the cell when formatting a time value.

Steps to reproduce:
1. Insert some time in a cell in spreadsheet (22:20)
2. Apply it a custom format that contains AM/PM (e.g. "h:mm AM/PM")

Observed: The AM/PM format is missing
Expected: AM or PM should be shown after the time (image attached)

Declined: The changes could be applied if the user presses OK button instead of pressing Enter key. A new feedback item is open where the issue is described: https://feedback.telerik.com/Project/143/Feedback/Details/212042-spreadsheet-custom-number-type-values-in-format-cells-dialog-are-not-applied-wh
The TableCellProperty.Padding property of the "TableNormal" StyleDefinition doesn't take effect in the UI. The same is valid for the TableProperties.CellPadding property.
To work this around, you can manually set the Padding property of all TableCell elements in the RadDocument.
 var cells = radDocument.EnumerateChildrenOfType<Telerik.Windows.Documents.Model.TableCell>();
 foreach (var cell in cells)
 {
     cell.Padding = new Padding(10);
 }
Hi Team,
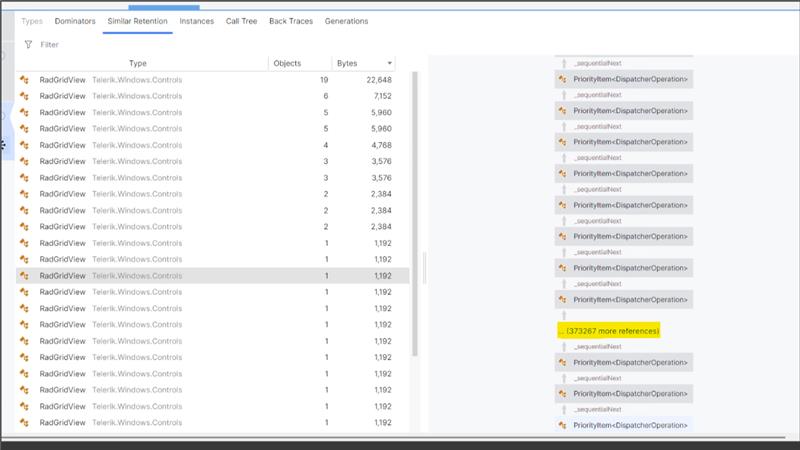
We have a large-scale WPF application that uses the Telerik WPF RadGridView across multiple screens. We are experiencing significant memory growth issues. Upon deep analysis of the memory dump, we observed that the RadGridView continuously pushes DispatcherPriority items into the Dispatcher queue. We also noticed an internal timer within the RadGridView that appears to be active even after the control is no longer visible. We would like to understand how to completely detach and stop this internal timer once the control is removed from the screen, and why the RadGridView keeps pushing DispatcherItem entries into the Dispatcher queue.
Telerik Version : 2017.2.503.45
When RadRichTextBox for WPF is hosted in a WinForms application (through ElementHost), typing with Japanese IME duplicates the typed letters, which makes the control unusable with the default behavior.

Possible workaround: Create custom caret. There are some suggestions in this forum thread: https://www.telerik.com/forums/richtextbox-doesn't-support-japanese-ime-when-hosted-in-winforms
At this time, Telerik UI for WPF distributes libraries build for each TFM -> WPF45, NetCore and NET50.
If there was a way that UI for WPF could compile some of those libraries .NET Standard 2.0 compatible, it would allow for the developers making the transition from .NET Framework to .NET Core/.NET5 a but easier because they will be able to share the reusable Telerik code in a class library consumed by both WPF45 and WFP50 projects
Are there any plans to release a Visual Studio 2022 theme for WPF? The Winforms UI has this theme, and I would like to have it for WPF as well.
Are there other themes on the roadmap that you could share?
Thanks!
--Darren
i have UriVectorTileMapProvider and i have files pbf.
When i create my style file json i cant get render corectly.
i have two example:
1)one in my style json i have three layers:buildings,military,hospital (ex1.png)
When I use such a file, one polygon is lying with buildings on top where the other polygon covers the buildings
"layers": [
{
"id": "landcover_wood",
"type": "fill",
"source": "openmaptiles",
"source-layer": "landuse",
"filter": [
"==",
"class",
"military"
],
"layout": {
"visibility": "visible"
},
"paint": {
"fill-color": "green"
}
},
{
"id": "landcover_hos",
"type": "fill",
"source": "openmaptiles",
"source-layer": "landuse",
"filter": [
"==",
"class",
"hospital"
],
"layout": {
"visibility": "visible"
},
"paint": {
"fill-color": "yellow"
}
},
,
{
"id": "building",
"type": "fill",
"source": "openmaptiles",
"source-layer": "building",
"minzoom": 12,
"maxzoom": 24,
"paint": {
"fill-color": {
"stops": [
[
13,
"yellow"
],
[
16,
"red"
]
]
}
}
}
]
2) if i have this style json, telering dont recognize color for every layers like hospital or military i have black (ex2.png)
"layers": [
{
"id": "landuse_classes",
"type": "fill",
"source": "openmaptiles",
"source-layer": "landuse",
"minzoom": 7,
"layout": {
"visibility": "visible"
},
"paint": {
"fill-color": [
[
"military"
],
"green",
[
"hospital"
],
"red",
"purle"
]
},
"metadata": {},
"filter": [
"all",
[
"in",
"class",
"military",
"hospital"
]
]
},
{
"id": "building",
"type": "fill",
"source": "openmaptiles",
"source-layer": "building",
"minzoom": 12,
"maxzoom": 24,
"paint": {
"fill-color": {
"stops": [
[
13,
"yellow"
],
[
16,
"red"
]
]
}
}
}
]
}
whats wrong with my json file style?
I have created this timeline control out of a combination of different controls. But I get asked for this same kind of setup from different companies for different reason. I have created this control using your TreeListView to show the headers in the hierarcy while for Layer Num items, there is a list to the right which holds a list of MediaItem objects. It works but not very efficient and is missing much key functionality. And I thought because you already have controls that are similar, it wouldn't be a huge reach for you to make on like this.
So there could be two modes for this. The editing mode where the user is dragging/dropping media items on each layer item, rearranging, setting the length of media, etc. They could then hit PLAY like a Movie Maker and see a preview on a different control of what is being played. Once this is saved, it could be used in another way.
So in the readonly mode, all the items would be feed in as a hierarchtial collection. It would decribe how many levels there are and the names and order of the items. And then it would also have all the MediaItems related to each Layer Num. And then it would constantly be fed what the current time is related to this batch of items playing. The user doesn't hit PLAY in this mode but rather just sees a read only version of what is being played and watch the line goes across.
I think this would be a very welcomed control to your lineup. Because anyone who wants to make a media editing program, audio editing program, and even showing a schedule for items that happens every 30 seconds in different locations while getting a constant status of the current time would find this invaluable.
Can be reproduced in the WPF demo (Windows8 theme): the error description tooltip appears on the left of the control and with the red arrow on the left (see attachment). The tooltip should appear on the same side of the red adorned element (the red triangle, top right corner) and the tooltip arrow should point the control.
When biding IsVisible of column in RadMultiColumnComboBox/GridViewItemsSourceProvider using MVVM pattern, the binding won't work initially, but is works as expected if removing the ElementName and adding it back in the below example xaml using debugger.
PS1. The binding for CheckBox(in the below sample) works with issue but not for RadMultiColumnComboBox
PS2. Also attached full sample code.
<Window x:Class="TestProject.MainWindow"
                xmlns="http://schemas.microsoft.com/winfx/2006/xaml/presentation"
                xmlns:x="http://schemas.microsoft.com/winfx/2006/xaml"
                xmlns:telerik="http://schemas.telerik.com/2008/xaml/presentation"
                xmlns:local="clr-namespace:TestProject"
                Title="MainWindow" Height="350" Width="525">
    <Grid Margin="0,0,0,20" x:Name="rootGrid">
        <Grid.RowDefinitions>
            <RowDefinition Height="Auto"/>
            <RowDefinition Height="Auto"/>
            <RowDefinition Height="Auto"/>
        </Grid.RowDefinitions>

        <Button Grid.Row="0" Command="{Binding ToggleCmd}">Toggle Last Name Visible</Button>
        <CheckBox Grid.Row="1" IsChecked="{Binding IsLastNameVisible}">Is Last Name Visible</CheckBox>

        <telerik:RadMultiColumnComboBox Grid.Row="2">
            <telerik:RadMultiColumnComboBox.ItemsSourceProvider>
                <telerik:GridViewItemsSourceProvider ItemsSource="{Binding AllClubs}" AutoGenerateColumns="false" >
                    <telerik:GridViewItemsSourceProvider.Columns>
                        <telerik:GridViewDataColumn DataMemberBinding="{Binding FirstName}"   />
                        <telerik:GridViewDataColumn DataMemberBinding="{Binding LastName}"
                                                    IsVisible="{Binding DataContext.IsLastNameVisible , ElementName=rootGrid}" />
                    </telerik:GridViewItemsSourceProvider.Columns>
                </telerik:GridViewItemsSourceProvider>
            </telerik:RadMultiColumnComboBox.ItemsSourceProvider>
        </telerik:RadMultiColumnComboBox>

    </Grid>
</Window>
The issue is reproducible only on Windows XP. On newer versions of windows, the images are rendered as expected.

WORKAROUND: You may inherit DctDecode class in order to implement custom decoder. For instance, you may try calling DecodeWithJpegDecoder method from the base class as mentioned in the note of this documentation article:

http://docs.telerik.com/devtools/wpf/controls/radpdfviewer/customization-and-extensibility/customize-pdf-rendering

A sample implementation of these custom decoder may be seen below:

public class CustomDctDecode : DctDecode
{
    public override byte[] Decode(PdfObject decodedObject, byte[] inputData, DecodeParameters parms)
    {
        return DecodeWithJpegDecoder(inputData);
    }
}
Dear Telerik Development Team,
First of all, I want to thank you for your great work on the RadTileView control for WPF. I appreciate the effort and attention to detail that you have invested in this component.
In my projects, RadTileView has brought significant value thanks to its visual appearance, the smooth animation when maximizing or restoring tiles, and the ability to provide distinct content for minimized and maximized states. It truly enhances the user experience, and I find the dynamic layout engaging and modern.
However, I have faced some challenges related to tile reordering and positioning:
The drag & drop rearrangement mechanism sometimes behaves in unpredictable or unintuitive ways, especially when there are many tiles or when tiles have different sizes.
There is currently no straightforward way to specify the exact row and column position of each tile when dynamically adding them from code.
It would be extremely useful to have a way to control or "lock" a tile to a specific grid position, for example by exposing explicit row and column properties for each tile, or by allowing developers to define the exact layout coordinates when adding tiles dynamically. This feature would make it possible to programmatically manage tile placement in complex dashboards, rather than relying only on the automatic layout and drag & drop interactions.
Such functionality would be highly beneficial in many scenarios, especially for enterprise dashboards where the layout must follow strict business requirements and should not be left to chance or automatic algorithms.
Would it be possible to consider this kind of feature for a future release?
If there is a known workaround or recommended approach to achieve precise tile positioning with the current RadTileView, I would greatly appreciate your guidance.
Thank you again for your work and support.
Looking forward to your reply!
Best regards,