Currently, if you create a custom DraggingService of RadDiagram and override the drag methods (StartDrag, Dragging, etc.), the corresponding drag events stop reporting if you don't call the base method implementation. Add protected methods like OnDragging and OnStartDrag that raise the corresponding events. This will allow the developer to manually raise the events if the drag method overrides are implemented from scratch, without calling the base implementation.
In the meantime, you can use custom events like so:
public class CustomDraggingService : DraggingService
{
    public event EventHandler<PositionChangedEventArgs> CustomDraggingEvent;


    public CustomDraggingService(IGraphInternal graph) : base(graph)
    {
    }

    public override void Drag(Point newPoint)
    {
        CustomDraggingEvent?.Invoke(this, new PositionChangedEventArgs(new Point(), newPoint, null));
// custom implementation here
    }
}
Instead, we could change this behavior to raise an exception, which will not be caught when a custom type, which is not allowed, gets de-serialized.
This is a regressiion issue in the 2024.3.924 release of Telerik UI for WPF.
Save and load of the saved XML should result of the same item IDs for every RadDiagramItem (shapes, connections).
To work this around, you can create a custom SerializationService and override its DeserializeItems method, where you can change the "makeUnique" parameter.
The issue manifests also when doing drag/drop from the RadDiagramToolBox or any other custom drag drop implementation that uses the DiagramDropInfo class (which is automatically handled by the RadDiagram's drop internal code). In this case the custom service approach won't work because the drag/drop deserialization works with a separate instance of SerializationService (SerializationService.Default) which cannot be changed. In this case, you can subscribe RadDiagram to the DragDropManaged.Drop event and manually call the SerializationService.Default.DeserializeItems method.
 public class CustomSerializationService : SerializationService
 {
     public CustomSerializationService(IGraphInternal graph) : base(graph)
     {
     }

     public override IEnumerable<IDiagramItem> DeserializeItems(SerializationInfo serializationInfo, bool makeUnique = false)
     {
         makeUnique = false;
         return base.DeserializeItems(serializationInfo, makeUnique);
     }
 }
public MainWindow()
{
InitializeComponent();
this.diagram.ServiceLocator.Register<ISerializationService>(new CustomSerializationService(this.diagram));
DragDropManager.AddDropHandler(this.diagram, OnDiagramDrop);
}
private void OnDiagramDrop(object sender, Telerik.Windows.DragDrop.DragEventArgs e)
{
var data = DragDropPayloadManager.GetDataFromObject(e.Data, typeof(DiagramDropInfo).Name);
if (data is DiagramDropInfo)
{
SerializationService.Default.DeserializeItems(((DiagramDropInfo)data).Info, false);
}
}
The middle point in this context is a point that is located on the line segment that is positioned after the middle length of the line. Add a property on the RadDiagramConnection class that returns the middle point. The property should be DependencyProperty so it can be bound with OneWayToSource mode in order to be able to notify the bound view model (if such is presented).
Currently, you can get this information by combining the CalculateMiddlePointOfLine and AllPoints methods of the ConnectionUtilities class.
var allConnectionPoints = Telerik.Windows.Diagrams.Core.ConnectionUtilities.ConnectionUtilities.AllPoints(radDiagramConnection);
var startAndEndPoints = new Tuple<Point, Point>(radDiagramConnection.StartPoint, radDiagramConnection.EndPoint);
Point middlePoint = Telerik.Windows.Diagrams.Core.ConnectionUtilities.CalculateMiddlePointOfLine(startAndEndPoints, allConnectionPoints);
In the Swimlane diagram example (Data Visualization -> Diagrams -> Swimlane) the application crashes, showing at least one but often more than one error message.
How to reproduce:
- Open the Swimlane example.
- Click the area that is labelled as "Process name" (also marked in the attached screenshot)
- One or multiple Message boxes containing the exception message
{DependencyProperty.UnsetValue} is not a valid value for the Property "Background"pop up (see other screenshot)
Currently, the print preview control provides only options for the current printer, the page orientation and the page size . Include the following options too:
- Paper Format (Lettre, A4, etc.)
- Paper Orientation (Portrait or Landscape)
- Number of copies (1, 2, 3, ...)
- Print Color Settings (Colors or Monochrome)
- Margins
- Resolution (DPI based on the capabilities of the printer)
Add a RotationAngle property or a Rotate() method or something similar that will automatically update the rotation of the ManipulationAdorner along with the shapes inside.
Add an option to modify the StartPoint and EndPoint properties of RadDiagramConnection instances via the SettingsPane.
This functionality can be achieved by modifying the default ControlTemplate of the SettingsPaneView element to include an additional RadTabItem instance in the RadTabControl element. In the additional RadTabItem, input controls can be used, such as the RadNumericUpDown element. These elements should modify properties that will be present in a custom LinkViewModelBase<NodeViewModelBase>> class. More specifically, the X and Y properties of the StartPoint and EndPoint properties of the RadDiagramConnection element.
The attached sample project shows the implementation of the above approach for achieving this requirement.
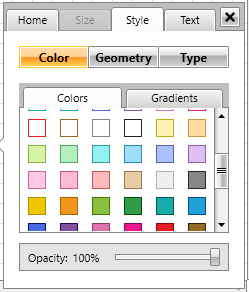
Add an option to customize the available colors in the SettingsPane control: