For the Spanish culture, some of the localization strings are for the German culture.
The following resource keys are the ones containing wrong values:
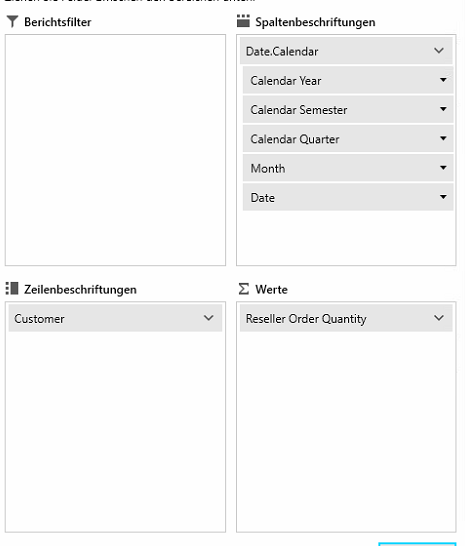
- PivotInlineFieldList_ValuesEmptyText
- PivotInlineFieldList_RowsEmptyText
- PivotInlineFieldList_ColumnsEmptyText
- PivotInlineFieldList_FiltersEmptyText
- Pivot_AggregateSum
- PivotFieldList_SetSumAggregate
- PivotFieldList_Top10Sum
- PivotFieldList_StringFormatDescription
To work around this, you could introduce a custom LocalizationManager and override the GetStringOverride method.
More information about this suggestion can be found here.
We could add an option to allow the copying of the raw data instead.
In your demo select PivotGrid - Olap Support
1. add "Exchange Rates: Average Rate" to values
2. sort rows by "Reseller Order Quantity"
-> The grid will be empty
If the list is filtered by "Total Reseller Order Quantity != 0", results will show again. Thus, sorting by a column which contains rows without values seems to be faulty.
In your Demo select PivotGrid - OLAP Support
1. sort rows by "Reseller Order Quantity"
2. reopen sorting panel
-> another option will be selected
In the sorting options dialog, the selected column in the sorting options appears to be set to a wrong value upon reopening the dialog.
Allow selecting and higlighting the group header visual.
Currently, the Telerik.Pivot.DataProviders.Adomd project relies on that the Microsoft.AnalysisServices.AdomdClient dll is installed in the GAC. The dll is installed with the ADOMD feature package that come with the SQL Server installation. If the required SQL Server feature is not installed on the machine, the Microsoft.AnalysisServices.AdomdClient.dll is missing from the GAC and the installation of the Telerik.Pivot.DataProviders.Adomd.for.Wpf package fails with an error. The error is:
Failed to add reference. The package 'Telerik.Pivot.DataProviders.Adomd.for.Wpf.Xaml' tried to add a framework reference to 'Microsoft.AnalysisServices.AdomdClient' which was not found in the GAC. This is possibly a bug in the package. Please contact the package owners for assistance.
Add a dependency to the Microsoft.AnalysisServices.AdomdClient package, instead of relying on the dll installed in the GAC.
Setup like so and hit refresh
A customer reported this issue. We could observe that the memory of the process was exploding, this doesnt happen in the demo for some reason.
Using the old RadarSoft WinForms Pivot Control, the same view that our customer had issues with, is loading in a reasonable time.
Please also make sure that in future releases you add some cancel functionality so one doesn't have to restart the application....
Currently, you can use the FilterDescriptions of the Olap data providers (like AdomdDataProvider and XamlDataProvider) or the GroupFilter of the group descriptions.
Add an API that allows you to implement custom filtering behavior using a filtering function or constructing custom filtering expression.
The caption sounds ocnfusing, but i couldn't come up with a better one:
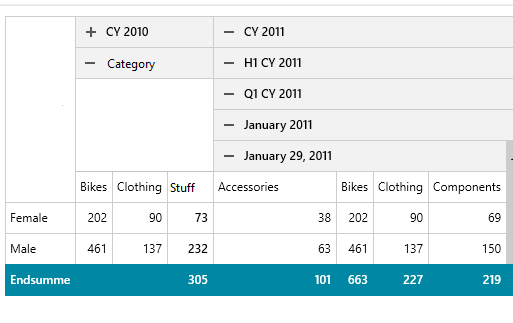
Problem is, if you have hirarchical data like Date.Calendar, you have "sub" values that can be collapsed and expanded
Problem is, when you have more headers, that sit below therese hirarchies, they will be collapsed too.
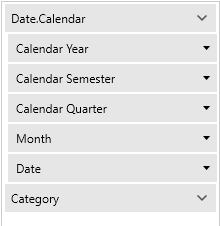
In this example, "Category" sits below there.
See how the Category is not visible, because Icollapsed the whole year 2010.
Compare that to 2011 where all categories are visible, because its fully expanded.
The feature I am requesting here is to still be able to show columns for each category and aggregated values, even though the year is collapsed.
I know this would be acchieved by moving category on top of the headers, but this also changes orders of the columns.
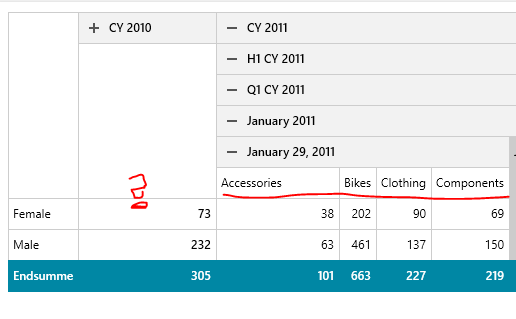
Our old windows forms pivot grid had this kind of functionality.
MSPaint to the rescue, this is how I imagine it (ignore the numbers, they do not make sense)