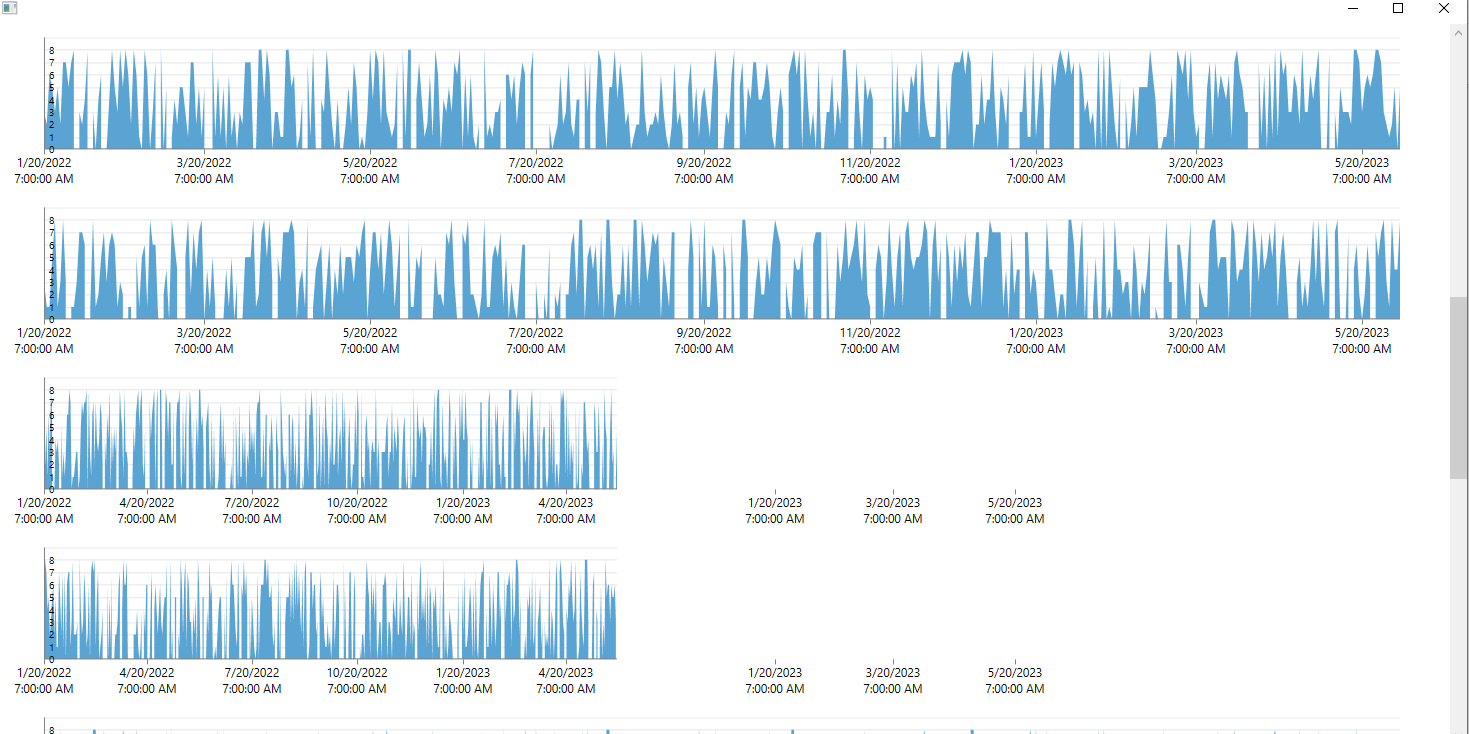
The problem arises when we have many graphs on one window and when we scroll to the bottom then to the middle of the window and then resize the width of the window, not all graphics dynamically resize, some harden to the previous size.
I am attaching a project in which you can reproduce the problem.
And I am attaching a video where the problem is clearly demonstrated.
Please solve the problem as soon as possible for our product it is critical!
Hello Nazar,
Currently we cannot promise an estimated time for a fix. We investigated the issue and there are no wrong calculations or properties with wrong values when the charts become shortened unexpectedly. This makes us think the origin of the problem is somewhere in the framework where heavy re-draw operations are performed in a moment of scrollviewer resize. This is only a hypothesis and we haven't isolated it yet. However, it seems to us that decreasing the charts in the Viewport can be a step in limiting this behavior. Our tests showed that placing all charts in a virtualized vertical listbox, instead of scrollviewer with stack panel limits the incorrect chart drawn a lot, but still after a lot of maximize /scroll/resize operations there might be some charts drawn incorrectly.
<Window
	x:Class="ChartsExample.MainWindow"
		xmlns="http://schemas.microsoft.com/winfx/2006/xaml/presentation"
	xmlns:x="http://schemas.microsoft.com/winfx/2006/xaml"
	xmlns:chartsExample="clr-namespace:ChartsExample">
	<ListBox  VirtualizingStackPanel.IsVirtualizing="True" ItemsSource="abcdefghijklmnopqrstuv" MaxHeight="800">
		<ListBox.ItemContainerStyle>
			<Style TargetType="ListBoxItem">
				<Setter Property="HorizontalContentAlignment" Value="Stretch" />
			</Style>
		</ListBox.ItemContainerStyle>
		<ListBox.ItemTemplate>
			<DataTemplate>
				<chartsExample:CartesianChart/>
			</DataTemplate>
		</ListBox.ItemTemplate>
   </ListBox>
</Window>
Regards,
Petar Mladenov
Progress Telerik
Love the Telerik and Kendo UI products and believe more people should try them? Invite a fellow developer to become a Progress customer and each of you can get a $50 Amazon gift voucher.
When will you fix the issue related to the SmartLabelsMode of the axis?
It is not suitable for us to set MajorStep manually because the date changes dynamically and we need SmartLabelsMode.
Hello Nazar,
I can confirm that this is an issue in the chart measure. This is why I've changed the status of the item to Unplanned (confirmed). The issue is related to the SmartLabelsMode of the axis. In your case this is the horizontal axis (the DateTimeContinuous one).
To work this around, you avoid setting the SmartLabelsMode property. Instead, you can leave the default range calculation of the chart. If this doesn't work for you, then you can manually adjust the range using the MajorStep and MajorStepUnit properties of the axis. Please try this idea and let me know how it goes.
Regards,
Martin Ivanov
Progress Telerik
Virtual Classroom, the free self-paced technical training that gets you up to speed with Telerik and Kendo UI products quickly just got a fresh new look + new and improved content including a brand new Blazor course! Check it out at https://learn.telerik.com/.
Hi Nazar,
Thank you for the report. I am testing this and will get back to you later today.
Regards,
Martin Ivanov
Progress Telerik
Love the Telerik and Kendo UI products and believe more people should try them? Invite a fellow developer to become a Progress customer and each of you can get a $50 Amazon gift voucher.
- All
- Completed (3554)
- Declined (776)
- Duplicated (58)
- In Development (5)
- Under Review (1)
- Unplanned (3205)
- Won't Fix (151)
- All
- UI for WPF
- AI Coding Assistant
- AIPrompt
- AutoCompleteBox
- AutoSuggestBox
- Badge
- Barcode
- BarcodeReader
- Book
- BreadCrumb
- BulletGraph
- BusyIndicator
- Buttons
- Calculator
- Calendar
- Callout
- CardView
- Carousel
- ChartView
- ChartView3D
- Chat
- CircularProgressBar
- CloudUpload
- CollectionNavigator
- ColorEditor
- ColorPicker
- ComboBox
- ContextMenu
- Data Virtualization
- DataBar
- DataFilter
- DataForm
- DataPager
- DataServiceDataSource
- DatePicker
- DateRangePicker
- DateTimePicker
- DesktopAlert
- Diagram
- Docking
- DragAndDropManager
- DragDropManager
- EntityFrameworkCoreDataSource
- EntityFrameworkDataSource
- Expander
- ExpressionEditor
- ExpressionParser
- FileDialogs
- FilePathPicker
- GanttView
- Gauge
- GridView
- HeatMap
- HighlightTextBlock
- ImageEditor
- Installer and VS Extensions
- LayoutControl
- Licensing
- ListBox
- Map
- MaskedInput
- Menu
- MultiColumnComboBox
- NavigationView
- NotifyIcon
- NumericUpDown
- OfficeNavigationBar
- OutlookBar
- PanelBar
- PasswordBox
- PDFViewer
- PersistenceFramework
- PipsPager
- PivotGrid
- ProgressBar
- PropertyGrid
- RadialMenu
- Rating
- RibbonView
- RichTextBox
- ScheduleView
- Slider
- SlideView
- Sparkline
- SpellChecker
- SplashScreen
- Spreadsheet
- StepProgressBar
- SvgImage
- SyntaxEditor
- TabbedWindow
- TabControl
- TaskBoard
- TileList
- TileView
- TimeBar
- TimeLine
- TimePicker
- TimeSpanPicker
- ToolBar
- ToolTip
- TouchManager
- TransitionControl
- TreeListView
- TreeMap and PivotMap
- TreeView
- VirtualGrid
- VirtualizingWrapPanel
- VirtualKeyboard
- WatermarkTextBox
- WebCam
- Window
- Wizard