Declined
Last Updated:
26 Sep 2019 13:19
by ADMIN
Vladimir
Created on:
15 Mar 2019 11:44
Category:
ChartView
Type:
Bug Report
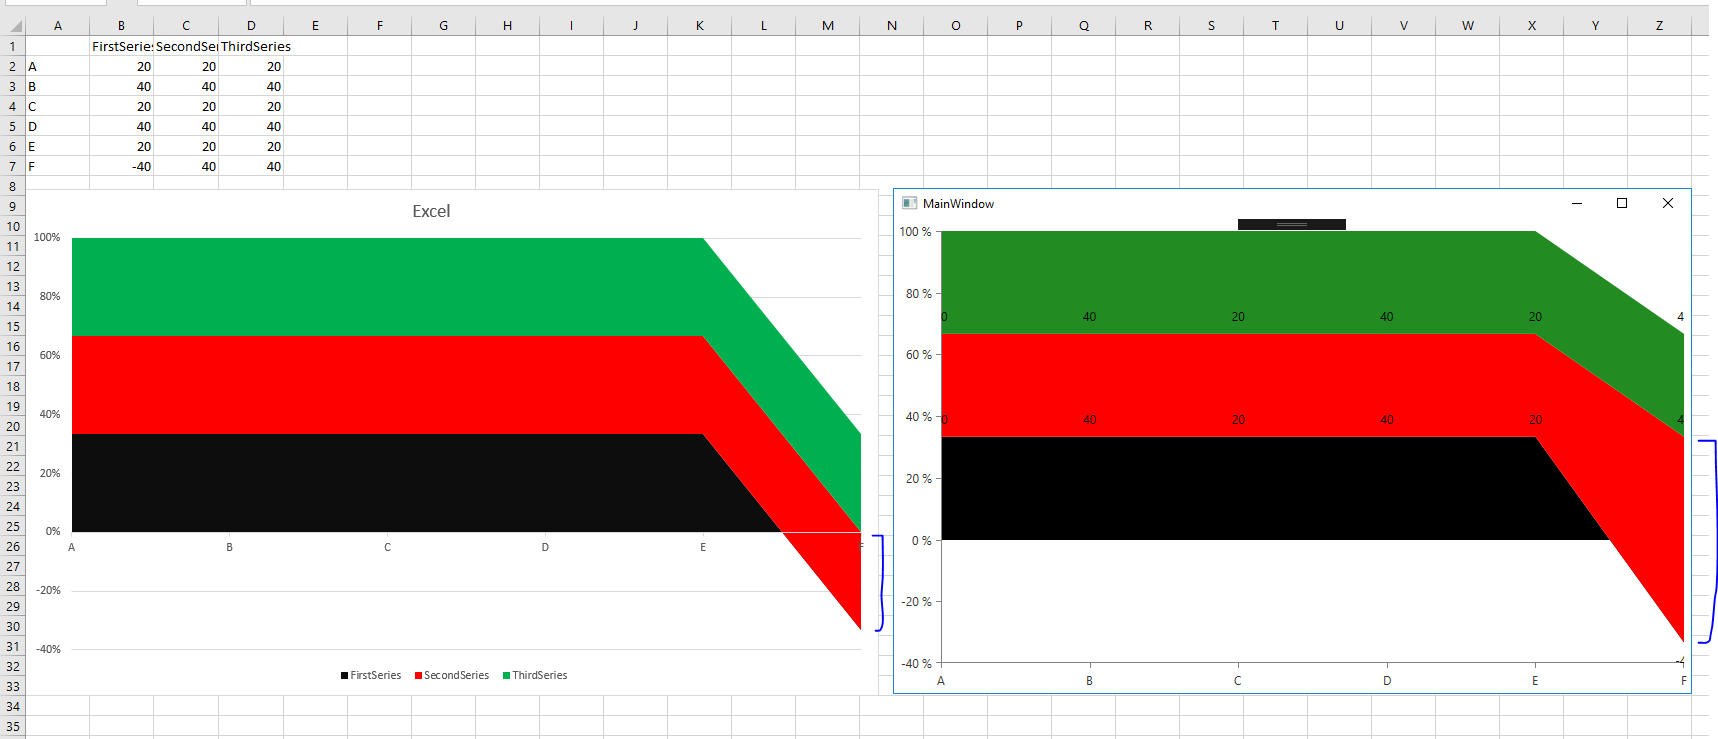
ChartView: Unexpected behavior with Stacked AreaSeries containing negative data point values
You can observe the difference between the ChartView and an Excel Chart with the same data in the attached pictures.
Attached Files:
3 comments
Petar
Posted on:
26 Sep 2019 13:18
Closing because of duplication with the following => https://feedback.telerik.com/wpf/1352386-chartview-stacked-areas-are-drawn-incorrectly-for-mixed-values
Scenario will be possible to achieve with setting chartview:ChartViewExtensions.StackNegativeValuesSeparately="False" on the RadCartesianChart in 2019 R3 SP and internal builds from 30 Sep 2019.
ADMIN
Vladimir Stoyanov
Posted on:
21 Mar 2019 16:09
Hello,
Thank you for the provided feedback.
I updated the internal feedback item accordingly and we will take this information into account when working on this issue.
Regards,
Vladimir Stoyanov
Progress Telerik
Thank you for the provided feedback.
I updated the internal feedback item accordingly and we will take this information into account when working on this issue.
Regards,
Vladimir Stoyanov
Progress Telerik
Get quickly onboarded and successful with your Telerik and/or Kendo UI products with the Virtual Classroom free technical training, available to all active customers. Learn More.
CB
Posted on:
15 Mar 2019 15:05
Also worth noting the issue is present in Stack100 AreaSeries as well:
Attached Files:
Type
Status
- All
- Completed (3542)
- Declined (776)
- Duplicated (58)
- In Development (3)
- Planned (1)
- Unplanned (3214)
- Won't Fix (151)
Category
- All
- UI for WPF
- AI Coding Assistant
- AIPrompt
- AutoCompleteBox
- AutoSuggestBox
- Badge
- Barcode
- BarcodeReader
- Book
- BreadCrumb
- BulletGraph
- BusyIndicator
- Buttons
- Calculator
- Calendar
- Callout
- CardView
- Carousel
- ChartView
- ChartView3D
- Chat
- CircularProgressBar
- CloudUpload
- CollectionNavigator
- ColorEditor
- ColorPicker
- ComboBox
- ContextMenu
- Data Virtualization
- DataBar
- DataFilter
- DataForm
- DataPager
- DataServiceDataSource
- DatePicker
- DateRangePicker
- DateTimePicker
- DesktopAlert
- Diagram
- Docking
- DragAndDropManager
- DragDropManager
- EntityFrameworkCoreDataSource
- EntityFrameworkDataSource
- Expander
- ExpressionEditor
- ExpressionParser
- FileDialogs
- FilePathPicker
- GanttView
- Gauge
- GridView
- HeatMap
- HighlightTextBlock
- ImageEditor
- Installer and VS Extensions
- LayoutControl
- Licensing
- ListBox
- Map
- MaskedInput
- Menu
- MultiColumnComboBox
- NavigationView
- NotifyIcon
- NumericUpDown
- OfficeNavigationBar
- OutlookBar
- PanelBar
- PasswordBox
- PDFViewer
- PersistenceFramework
- PipsPager
- PivotGrid
- ProgressBar
- PropertyGrid
- RadialMenu
- Rating
- RibbonView
- RichTextBox
- ScheduleView
- Slider
- SlideView
- Sparkline
- SpellChecker
- SplashScreen
- Spreadsheet
- StepProgressBar
- SvgImage
- SyntaxEditor
- TabbedWindow
- TabControl
- TaskBoard
- TileList
- TileView
- TimeBar
- TimeLine
- TimePicker
- TimeSpanPicker
- ToolBar
- ToolTip
- TouchManager
- TransitionControl
- TreeListView
- TreeMap and PivotMap
- TreeView
- VirtualGrid
- VirtualizingWrapPanel
- VirtualKeyboard
- WatermarkTextBox
- WebCam
- Window
- Wizard