https://stackblitz.com/edit/angular-sdmdrbjt-5yunmeo2
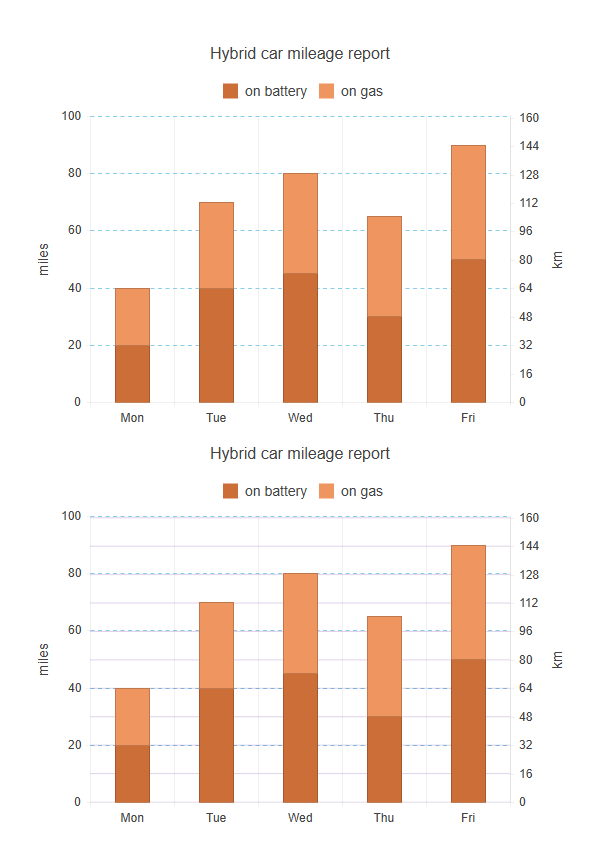
Currently, in Kendo UI for Angular Charts, when using multiple axes of the same orientation (e.g., two Y axes), only the major grid lines of the first axis are displayed. The grid lines of the second axis (Y2) are ignored, even if enabled in the configuration. This limits the readability of multi-axis charts, as it is not possible to visually distinguish the graduations of each axis.
Add an option (for example, showGridLinesOnAllAxes: true) that would allow displaying major grid lines on all axes, not just the primary one.
The Kendo team suggests using plot bands to simulate the grid lines of the second axis, but this solution is less convenient and requires manual configuration.
Below is a screenshot of what it might look like; the first graph shows what is currently possible, and the second shows what would be possible if this feature were added.
- All
- Completed (449)
- Declined (461)
- Duplicated (87)
- In Development (2)
- Pending Review (1)
- Planned (1)
- Unplanned (748)
- All
- Kendo UI for Angular
- ActionSheet
- Agentic UI Generator
- AIPrompt
- AppBar
- ArcGauge
- AutoComplete
- Avatar
- Badge
- Barcode
- BottomNavigation
- BreadCrumb
- BrowserExtension
- Button
- ButtonGroup
- Calendar
- Card
- Chart Wizard
- Charts
- Chat
- CheckBox
- Chip
- ChipList
- ChunkProgressBar
- CircularGauge
- CircularProgressBar
- ColorGradient
- ColorPalette
- ColorPicker
- ComboBox
- ContextMenu
- DataQuery
- DateInput
- DateMath
- DatePicker
- DateRange
- DateTimePicker
- Diagram
- Dialog
- Drag and Drop
- Drawer
- Drawing
- DropDownButton
- DropDownList
- DropDownTree
- Editor
- ExcelExport
- ExpansionPanel
- FileSaver
- FileSelect
- Filter
- FlatColorPicker
- FloatingActionButton
- FloatingLabel
- FormField
- Forms
- Gantt
- Grid
- GridLayout
- Icon
- InlineAIPrompt
- Label
- Licensing
- LinearGauge
- ListBox
- ListView
- Loader
- Map
- MaskedTextBox
- Menu
- MultiColumnComboBox
- MultiSelect
- MultiSelectTree
- MultiViewCalendar
- Notification
- NumericTextBox
- OTP Input
- Page Templates / Building Blocks
- Pager
- PanelBar
- PDFExport
- PDFViewer
- PivotGrid
- Popover
- Popup
- ProgressBar
- PromptBox
- QRCode
- RadialGauge
- RadioButton
- RangeSlider
- Rating
- Ripple
- Sankey
- Scheduler
- ScrollView
- SegmentedControl
- Signature
- Skeleton
- Slider
- SmartPasteButton
- Sortable
- Sparkline
- SpeechToTextButton
- SplitButton
- Splitter
- Spreadsheet
- StackLayout
- Stepper
- StockChart
- SVGIcon
- Switch
- TabStrip
- TextArea
- TextBox
- TileLayout
- Timeline
- TimePicker
- ToolBar
- Tooltip
- TreeList
- TreeView
- Typography
- Upload
- VS Code Extension
- WebMCP
- Window