Unplanned
Last Updated:
01 May 2019 13:59
by ADMIN
ADMIN
Danail Vasilev
Created on:
11 Apr 2014 07:59
Category:
HtmlChart
Type:
Feature Request
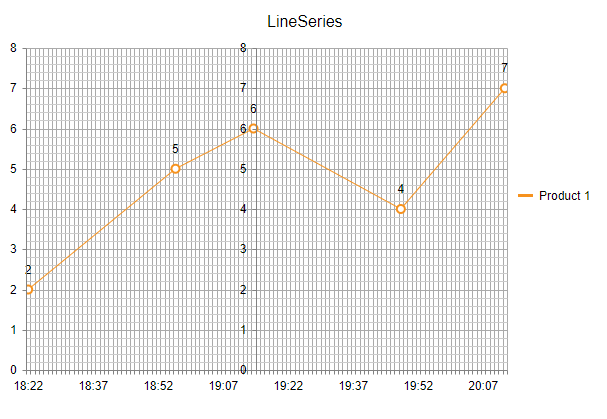
Improve RadHtmlChart XAxis' AxisCrossingPoint so that it accepts DateTime object
For the time being the DateTime object can be set to the AxisCrossingPoint on the client. For example:

ASPX:

		<script>
			function OnLoadHandler(sender, args) {
				var kendoChart = sender.get_kendoWidget();
				var opts = kendoChart.options;
				opts.categoryAxis.axisCrossingValues = [0, new Date("2014, 11, 05, 19:15:00")];
				kendoChart.setOptions(opts);
			}
		</script>
		<telerik:RadHtmlChart runat="server" ID="RadHtmlChart1" Width="600px" Height="400px">
			<ClientEvents OnLoad="OnLoadHandler" />
			<PlotArea>
				<Series>
					<telerik:LineSeries Name="Product 1" DataFieldY="SellQuantity">
					</telerik:LineSeries>
				</Series>
				<XAxis DataLabelsField="SellDate" BaseUnit="Minutes">
					<LabelsAppearance Step="15"></LabelsAppearance>
					<MinorGridLines Visible="false" />
					<AxisCrossingPoints>
						<telerik:AxisCrossingPoint Value="10" />
					</AxisCrossingPoints>
				</XAxis>
				<AdditionalYAxes>
					<telerik:AxisY></telerik:AxisY>
				</AdditionalYAxes>
			</PlotArea>
			<ChartTitle Text="LineSeries"></ChartTitle>
		</telerik:RadHtmlChart>


C#:
	protected void Page_Load(object sender, EventArgs e)
	{
		if (!Page.IsPostBack)
		{
			RadHtmlChart1.DataSource = GetData();
			RadHtmlChart1.DataBind();
		}
	}

	protected DataTable GetData()
	{
		DataTable dt = new DataTable();

		dt.Columns.Add("ID", typeof(int));
		dt.Columns.Add("SellQuantity", typeof(int));
		dt.Columns.Add("SellDate", typeof(DateTime));

		dt.Rows.Add(1, 2, new DateTime(2014, 11, 05, 18, 22, 22));
		dt.Rows.Add(2, 5, new DateTime(2014, 11, 05, 18, 56, 22));
		dt.Rows.Add(3, 6, new DateTime(2014, 11, 05, 19, 14, 22));
		dt.Rows.Add(4, 4, new DateTime(2014, 11, 05, 19, 48, 22));
		dt.Rows.Add(5, 7, new DateTime(2014, 11, 05, 20, 12, 22));

		return dt;
	}
5 comments
ADMIN
Vessy
Posted on:
01 May 2019 13:59
Victor
Posted on:
29 Apr 2019 15:31
ADMIN
Vessy
Posted on:
13 Mar 2019 14:37
Paul
Posted on:
06 Mar 2019 21:16
Michael
Posted on:
16 Apr 2014 10:49