If both the CSRF validation and the Session state is turned off, the pages containing AsyncUpload control will throw a null reference exception.
<appSettings>
  <add key="Telerik.AsyncUpload.EnableCsrfValidation" value="false" />
</appSettings>
<system.web>
  <sessionState mode="Off" />
In the demo:
https://demos.telerik.com/aspnet-ajax/editor/examples/trackchanges/defaultcs.aspx
1. (Preparation) Disable TrackChange and Remove all text. Enable Track Change back.
2. Insert table, (HTML View)
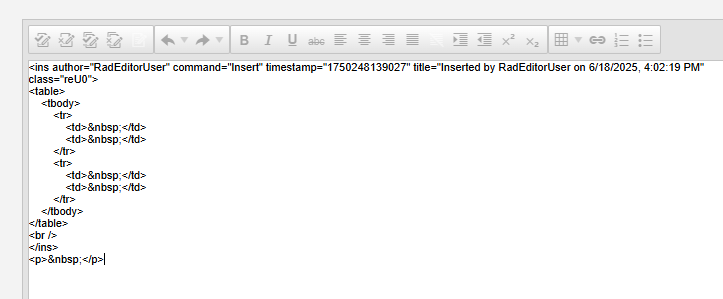
3. In the design mode set new paragraph after table:
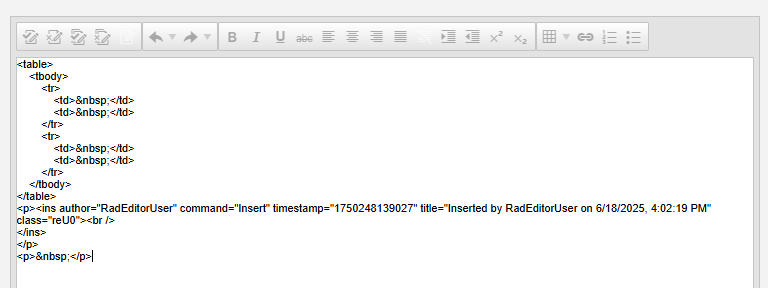
Insertion of the table dissapeared.
How to fix this issue?
We are encountering an issue with the RadListBox control (version 2026.1.225) where the container's scroll position abruptly jumps back to 0 when an item is selected. Tested with Edge, Chrome and Firefox. This issue can be reproduced directly on the official Progress live demo page.
Live Demo URL for Reproduction:
https://demos.telerik.com/aspnet-ajax/listbox/examples/functionality/reorder/defaultcs.aspx
- Open the demo page linked above.
- Scroll down to the bottom of the RadListBox using only the mouse wheel.
- Click on any item (e.g., "USA") to select it.
Observed behavior:
Immediately upon clicking the item, the container's scroll position snaps back to 0 (the top of the list). This happens consistently across all modern browsers (Edge, Chrome, and Firefox).
- The issue does not occur if the user clicks and drags the scrollbar thumb with the left mouse button before selecting an item.
- The issue does not occur if the user clicks the top or bottom navigation arrows on the scrollbar container to scroll.
- The unexpected reset to 0 only triggers when scrolling is performed exclusively via the mouse wheel prior to item selection.
Reproduction - http://somup.com/crVYIDot19
Setup to reproduce:
<telerik:RadContextMenu ID="RadContextMenu1" runat="server">
    <Targets>
        <telerik:ContextMenuDocumentTarget />
    </Targets>
    <Items>
        <telerik:RadMenuItem Text="item">
            <ItemTemplate>
                <asp:TextBox ID="TextBox2" runat="server" />
            </ItemTemplate>
        </telerik:RadMenuItem>
    </Items>
</telerik:RadContextMenu>

<telerik:RadButton runat="server" ID="RadButton2" Text="Postback" AutoPostBack="true" />
Steps to reproduce:
- Show the context menu with a right mouse click on the document.
- Type in a custom value in the TextBox embedded in the menu.
- Perform a postback by clicking on the RadButton.
- Show the context menu again. In the textbox, pick the autocomplete suggestion by the browser.
I'm using a RadTab and one of the RadPageViews starts with an RadAsyncUpload-Control. When I use arrow keys to select this tab and try to use the Tab-Key to focus the next element (the RadAsyncUpload in this case) nothing happens. If any other control (like a textbox) is placed above my upload control there is no problem focusing it.
You can see this in the attached Demoproject when using arrow keys to select to RpvUpload.
After updating to 2026.2 the layout of the SpinButton changed. To work around it, use the below CSS:
html body .RadInput .riUp,
html body .RadInput .riDown {
    height: 50%;
}
verified still present in 2026.2.519 — RadCalendarScript.js
When `EnableNavigationAnimation` is enabled (the default) and the browser zoom is not 100% (and Windows uses fractional display scaling such as 125%/150%),
navigating the RadCalendar to the NEXT month removes the day grid and never renders the new one. The calendar title updates, but the view area stays empty permanently.
Because `_enableNavigation(false)` and `EnableDateSelect = false` are set before the animation and only restored when it completes, the calendar is also left with navigation
and date selection disabled — the control is dead until the page is reloaded.
Navigating BACKWARD works correctly (see root cause below for why), which is a useful way to confirm this specific bug.
End users hit this routinely because Chrome persists per-site zoom and many laptops default to 125%/150% display scaling.
Steps to reproduce:
1. Page with a default RadCalendar:
<telerik:RadCalendar ID="RadCalendar1" runat="server" EnableNavigationAnimation="true" /> 2. Open in Chrome, set zoom to 110% (Ctrl and +), reload.
3. Click the "next month" arrow (repeat at a couple of zoom levels, e.g. 110%,
125%, 150% — whether a given level triggers it depends on rounding of the
calendar's rendered width).
The navigation animation detaches the current day-grid table, parks the old and new tables inside a temporary scroll container, and animates `scrollLeft`. Thenew table is re-attached to the DOM only when the animation loop finishes:
c = function () {
          o > 0 && r.scrollLeft + r.offsetWidth < r.scrollWidth ||
          o < 0 && r.scrollLeft > 0
              ? (r.scrollLeft += 10 * o, window.setTimeout(c, 10))
              : d();   // d() re-attaches the new table and re-enables the control
      };
`Element.scrollLeft` is a fractional double, while `offsetWidth`/`scrollWidth` are rounded integers. At zoom levels other than 100%, `scrollLeft` clamps at a fractional maximum (e.g. 219.4545) while the rounded widths suggest an integer maximum (e.g. 220 with scrollWidth 440). The forward-direction termination
check `scrollLeft + offsetWidth < scrollWidth` (439.45 < 440) then remains true forever: `scrollLeft += 10` is clamped and makes no further progress, so the loop reschedules itself indefinitely and `d()` is never called. The new view table is never appended, and navigation/date selection are never re-enabled.
The backward direction terminates on `scrollLeft > 0`, and `scrollLeft` clamps to exactly 0 — which is why only forward navigation is affected.
Setting `EnableNavigationAnimation="false"` avoids the animation code path entirely and fully resolves the issue.
RadColorPicker remains clickable when its set_enabled(false) method is called.

Steps to reproduce:
1. Run this code:

        <telerik:RadColorPicker ID="RadColorPicker1" runat="server" ShowIcon="true" ShowEmptyColor="false" RenderMode="Lightweight" />
        <br /><br /><br />
        <select id="mySelect" onchange="EnableDisableColorPicker()">
            <option value="1">1</option>
            <option value="2" selected="selected">2</option>

        </select>
        <script>
            function EnableDisableColorPicker() {
                var x = document.getElementById("mySelect").value;
                var colorPicker = $find("<%= RadColorPicker1.ClientID %>");
                if (x == 1) {
                    colorPicker.set_enabled(false);

                } else {
                    colorPicker.set_enabled(true);

                }
            }
        </script>

2. Select option 1.

Result: RadColorPicker gets disabled, but remains clickable
When attempting to view the page in design view, here's what it looks like:
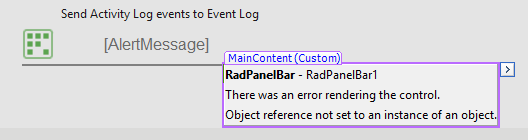
Here is the markup:
<telerik:RadPanelBar ID="RadPanelBar1" runat="server">
<Items>
<telerik:RadPanelItem runat="server" Expanded="True" PreventCollapse="true">
<HeaderTemplate>
<div ID="content-header">
Auditing Report | GPO Changes For User
</div>
</HeaderTemplate>
<ContentTemplate>
<div ID="content-body">
<telerik:ReportViewer ID="ReportViewer1" runat="server" ReportBookID="" Width="100%" Height="12in">
</telerik:ReportViewer>
</div>
</ContentTemplate>
</telerik:RadPanelItem>
</Items>
</telerik:RadPanelBar>
After upgrade an infinite "Loading..." is displayed when using load on demand:
<telerik:RadComboBox
    ID="ddlOldValues"
    runat="server"
    Filter="Contains"
    AllowCustomText="true"
    ShowMoreResultsBox="true"
    EnableLoadOnDemand="true"
    ItemsPerRequest="10"
    EnableVirtualScrolling="true"
    DataTextField="USERFULLNAME"
    DataValueField="USERFULLNAME">
    <WebServiceSettings Method="GetDynamicUsersUS" Path="WebService.asmx" />
</telerik:RadComboBox>
[WebService(Namespace = "http://tempuri.org/")]
[WebServiceBinding(ConformsTo = WsiProfiles.BasicProfile1_1)]
// To allow this Web Service to be called from script, using ASP.NET AJAX, uncomment the following line.
[System.Web.Script.Services.ScriptService]
public class WebService : System.Web.Services.WebService
{
    [WebMethod(EnableSession = true)]
    public RadComboBoxData GetDynamicUsersUS(RadComboBoxContext context)
    {
        RadComboBoxData comboData = new RadComboBoxData();

        try
        {
            DataTable data = GetUsersData();
            string filter = "USERFULLNAME LIKE '%" + context.Text + "%'";
            data.DefaultView.RowFilter = filter;
            DataTable dtData = data.DefaultView.ToTable();

            if (dtData == null || dtData.Rows.Count == 0)
            {
                dtData = data;
            }

            // Exact same GetComboData logic as frmBRMultipleUpdate.aspx.vb
            int itemsPerRequest = 10;
            int itemOffset = context.NumberOfItems;
            int endOffset = itemOffset + itemsPerRequest;

            if (endOffset > dtData.Rows.Count)
            {
                endOffset = dtData.Rows.Count;
            }

            // When data is exhausted, set EndOfItems to true
            if (itemOffset >= dtData.Rows.Count)
            {
                comboData.EndOfItems = true;
                comboData.Items = new RadComboBoxItemData[0];
                return comboData;
            }

            comboData.EndOfItems = (endOffset >= dtData.Rows.Count);

            var result = new List<RadComboBoxItemData>();
            for (int i = itemOffset; i < endOffset; i++)
            {
                var item = new RadComboBoxItemData();
                item.Text = dtData.Rows[i]["USERFULLNAME"].ToString();
                item.Value = dtData.Rows[i]["USERFULLNAME"].ToString();
                result.Add(item);
            }

            comboData.Items = result.ToArray();
            comboData.Message = string.Format("Items <b>{0}</b>-<b>{1}</b> out of <b>{2}</b>",
                itemOffset + 1, endOffset, dtData.Rows.Count);
        }
        catch (Exception ex)
        {
            comboData.Message = "No matches";
        }
        return comboData;
    }

    private static DataTable GetUsersData()
    {
        DataTable dt = new DataTable();

        dt.Columns.Add(new DataColumn("USERFULLNAME", typeof(string)));
        dt.Columns.Add(new DataColumn("EMAIL", typeof(string)));

        for (int i = 0; i < 200; i++)
        {
            int index = i + 1;

            DataRow row = dt.NewRow();

            row["USERFULLNAME"] = "User" + index;
            row["EMAIL"] = "user" + index + "@example.com";

            dt.Rows.Add(row);
        }

        return dt;
    }
}
To work-around it, set a Height to the ComboBox:
<telerik:RadComboBox
    Height="300px"
    ID="ddlOldValues"
    ...
1) There is no element with the id or name as the value of the aria-controls attribute of the dateinput button with enabled ARIA support.
2) The aria-valuemin and aria-valuemax attribute are not valid on role=textbox
To fix these, the following workarounds can be used
Option 1: OnClientLoad event of the DateInput element inside the DatePicker
function DatePickerOnClientLoad(sender) {
    setTimeout(function () {
        $telerik.$(sender.get_element()).parent().find("[role=button][aria-controls]").removeAttr("aria-controls");
        $telerik.$(sender.get_element()).removeAttr("aria-valuemin").removeAttr("aria-valuemax")
    })
}
Option 2: using Sys.Application.Load event
function pageLoadHandler() {
    $telerik.$("[role=button][aria-controls]");
    $telerik.$("[role=textbox]").removeAttr("aria-valuemin").removeAttr("aria-valuemax");
    // Sys.Application.remove_load(pageLoadHandler);
}
Sys.Application.add_load(pageLoadHandler);
There are missing keys in the resx files and the resource files are not applied correctly. More info here:
Hover over the command arrows on the radScheduler when the view is set to month view. The Tooltip will display "next day" and "previous day" instead of "next month" and "previous month".
The same happens for week view.
Temporary workaround:
<telerik:RadCodeBlock runat="server">
    <script>
        function pageLoadHandler() {
            var scheduler = $find("<%= RadScheduler1.ClientID %>");
            var $scheduler = $telerik.$(scheduler.get_element());
            var viewType = "Day";
            if (scheduler.get_selectedView() == Telerik.Web.UI.SchedulerViewType.WeekView) {
                viewType = "Week";
            } else if (scheduler.get_selectedView() == Telerik.Web.UI.SchedulerViewType.MonthView) {
                viewType = "Month";
            }

            $scheduler.find(".rsPrevDay").attr("title", "Previous " + viewType)
            $scheduler.find(".rsNextDay").attr("title", "Next " + viewType)

            // Sys.Application.remove_load(pageLoadHandler);
        }
        Sys.Application.add_load(pageLoadHandler);
    </script>
</telerik:RadCodeBlock>
Problem:

In the RadEditor we have the NewLineMode set to Div
We are also using a ToolsFile xml document to control the tools available in RadEditor.
The problem is the InsertParagraph tool now inserts <div> tags instead of <p> tags.
We want to keep the NewLineMode behavior as DIV while still having a tool that can insert a paragraph (i.e. a <p> tag).

To replicate this problem:

On the RadEditor demo page, first set "NEW LINES AS" to "Divs".
Then, in the editor content area just above the "Destinations" table, Type in three lines:
Comment1
Comment2
Comment3

If you then toggle to the HTML tab, you will see that the Comment1 line is (incorrectly) bracketed by a <p> tag while the Comment2 and Comment3 lines are (correctly) bracketed by <div> tags.

Next, go back to the Design tab and position yourself at the beginning of the Comment3 line then click the [Insert Paragraph] button.

In the newly inserted "paragraph" type "Comment2b".

If you then toggle to the HTML tab you will see that Comment2b is incorrectly bracketed by a <div> tag.  It should be a <p> tag.
RadEditor does not offer resx localization for the following Track Changes strings "Inserted by ", "Formatted by ", "Deleted by " as well as for the strings in the Comments dialog: Title, Save, Cancel and Edit.
1. Inside the editor (http://demos.telerik.com/aspnet-ajax/editor) copy and paste the contents of the attached file.

2. When prompted to clean the pasted data, select Yes.

3. Visually inspect the order of the list elements and the indentation - see the screenshot in the attachment.
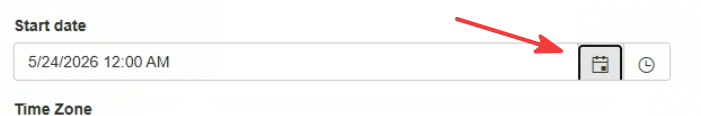
Hi,
After updating to the 2026.2.519 version, the icons for the date and time pickers are shifted a few pixels down. When clicked, a black rectangle appears around them, which, as you can see, it is truncated at the bottom. This is using the Bootstrap skin.