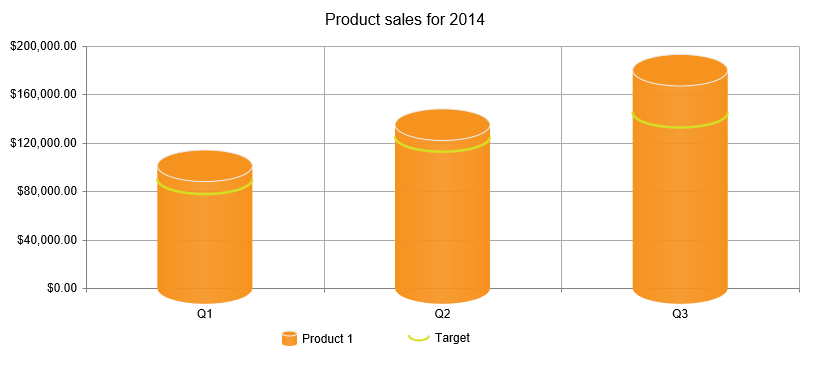
When using custom shapes (circles, triangles, etc) in a RadHtmlChart, the custom shape should be displayed in the legend instead of always a square. This is because when printing with a black & white printer, the colored squares won't help the reader read the chart, however the shapes would.
Hi guys,
You can se two approaches to add custom shapes in the chart legend in the following section of our documentation:
Regards,
Vessy
Progress Telerik
Love the Telerik and Kendo UI products and believe more people should try them? Invite a fellow developer to become a Progress customer and each of you can get a $50 Amazon gift voucher.
Hi kumar,
You can use the following sample as a base in order to create a custom kendo Chart visual:
https://stackoverflow.com/a/50743937
As this is a Feedback item, I would like to kindly ask you to use our ticketing system in case you have further question regarding chart.
Regards,
Vessy
Progress Telerik
Virtual Classroom, the free self-paced technical training that gets you up to speed with Telerik and Kendo UI products quickly just got a fresh new look + new and improved content including a brand new Blazor course! Check it out at https://learn.telerik.com/.
can you please provide me the kendo chart code for custom legend like above screenshot
can you please provide me the cylindrical shape legend with horizontal
Hi Kumar,
This can be achieved via the visual functionality of the control as explained in the documentation - https://docs.telerik.com/devtools/aspnet-ajax/controls/htmlchart/functionality/visual-template:

Regards,
Rumen
Progress Telerik
Virtual Classroom, the free self-paced technical training that gets you up to speed with Telerik and Kendo UI products quickly just got a fresh new look + new and improved content including a brand new Blazor course! Check it out at https://learn.telerik.com/.
For the time being you can either use Visuals or use the following workaround in order to control the type, width, height and margin for the legend marker items:
<script type="text/javascript"> function pageLoad() { var kendoWidget = $find("<%=RadHtmlChart1.ClientID%>").get_kendoWidget(); kendoWidget.options.series[0].legend = { marker: { type: "cross", width: 10, height: 15, margin: {top: 0} } }; kendoWidget.options.series[1].legend = { marker: { type: "triangle", width: 15, height: 15, margin: { top: 10, bottom: 10 } } }; kendoWidget.options.series[2].legend = { marker: { type: "circle", width: 10, height: 10, margin: { top: 0 } } }; kendoWidget.options.series[3].legend = { marker: { type: "rect", width: 10, height: 10, margin: { top: 0 } } }; kendoWidget.redraw(); } </script> <telerik:RadHtmlChart runat="server" ID="RadHtmlChart1" Width="600px" Height="400px"> <PlotArea> <Series> <telerik:ColumnSeries Name="Product 1"> <SeriesItems> <telerik:CategorySeriesItem Y="15000" /> </SeriesItems> </telerik:ColumnSeries> <telerik:ColumnSeries Name="Product 2"> <SeriesItems> <telerik:CategorySeriesItem Y="45000" /> </SeriesItems> </telerik:ColumnSeries> <telerik:ColumnSeries Name="Product 3"> <SeriesItems> <telerik:CategorySeriesItem Y="5000" /> </SeriesItems> </telerik:ColumnSeries> <telerik:ColumnSeries Name="Product 4"> <SeriesItems> <telerik:CategorySeriesItem Y="5000" /> </SeriesItems> </telerik:ColumnSeries> </Series> <XAxis> <Items> <telerik:AxisItem LabelText="1" /> </Items> </XAxis> </PlotArea> </telerik:RadHtmlChart> <script type="text/javascript"> dataviz = kendo.dataviz; deepExtend = kendo.deepExtend; ShapeElement = dataviz.ShapeElement; kendo.dataviz.LegendItem.fn.createMarker = function () { var item = this, options = item.options, markerColor = options.markerColor, markers = options.markers, markerType = "rect", markerWidth = 7, markerHeight = 7, markerMargin = { top: 0, left: 0, right: 0, bottom: 0 }; if (options.series.legend) { if (options.series.legend.marker) { if (options.series.legend.marker.type) { markerType = options.series.legend.marker.type; } if (options.series.legend.marker.width) { markerWidth = options.series.legend.marker.width; } if (options.series.legend.marker.height) { markerHeight = options.series.legend.marker.height; } if (options.series.legend.marker.margin) { markerMargin = options.series.legend.marker.margin; } } } var markerOptions = deepExtend({}, markers, { background: markerColor, border: { color: markerColor }, type: markerType, width: markerWidth, height: markerHeight, margin: markerMargin }); item.container.append(new ShapeElement(markerOptions)); } </script>Regards,
Rumen
Progress Telerik
You can find a workaround in this feedback item - http://feedback.telerik.com/Project/108/Feedback/Details/123802
- All
- Completed (3240)
- Declined (915)
- Duplicated (31)
- In Development (2)
- Pending Review (1)
- Under Review (1)
- Unplanned (965)
- Won't Fix (312)
- All
- UI for ASP.NET AJAX
- AIPrompt
- Ajax
- AjaxLoadingPanel
- AjaxPanel
- AsyncUpload
- AutoCompleteBox
- Avatar
- Badge
- Barcode
- BinaryImage
- Breadcrumb
- Button
- Calendar
- Captcha
- Card
- Chat
- CheckBox
- Chip
- ChipList
- ClientDataSource
- ClientExportManager
- CloudUpload
- ColorPicker
- ComboBox
- Compression
- DataForm
- DataPager
- DateInput
- DatePicker
- DateRangePicker
- DateTimePicker
- DeviceDetectionFramework
- Diagram
- Dock
- DragDropManager
- Drawer
- DropDownList
- DropDownTree
- Editor
- FileExplorer
- Filter
- FloatingActionButton
- FormDecorator
- Gantt
- Gauge
- Grid
- HtmlChart
- ImageButton
- ImageEditor
- ImageGallery
- Input
- InputManager
- Installer and VS Extensions
- Label
- Licensing
- LightBox
- LinkButton
- ListBox
- ListView
- Map
- MaskedTextBox
- MediaPlayer
- Menu
- MonthYearPicker
- MultiColumnComboBox
- MultiSelect
- Navigation
- Notification
- NuGet feed
- NumericTextBox
- ODataDataSource
- OrgChart
- OTPInput
- PageLayout
- PanelBar
- PdfViewer
- PersistenceFramework
- PivotGrid
- ProgressArea
- ProgressBar
- PushButton
- Rating
- RibbonBar
- Rotator
- Scheduler
- ScriptManager
- SearchBox
- Signature
- SiteMap
- SkinManager
- Slider
- SocialShare
- SpeechToTextButton
- Spell
- SplitButton
- Splitter
- Spreadsheet
- Stepper
- StyleSheetManager
- Switch
- TabStrip
- TagCloud
- Theme Builder
- Ticker
- TileList
- TimeLine
- TimePicker
- ToggleButton
- ToolBar
- ToolTip
- TreeList
- TreeMap
- TreeView
- Visual Style Builder
- Window
- Wizard
- XmlHttpPanel

