Hello,
In an live demo session we already discussed a certain need that we have (APG Group N.V.) From our need, we want to test desktop applications on regression. Your tool provides that, since we made a proof of concept based on a trial period we used to build some tests. But what we also want is to get insights into the duration of tests. We are a Dev-Ops based team that have all our workplaces almost fully automated, also when it comes to updates/patches. What we want is to see what the impact is of the updates/patches that are installed on the workplaces. We have structure in this process so changes in software go through certain rings to end in the production environment. Testing those software changes in the form of regression testing, is our pick.
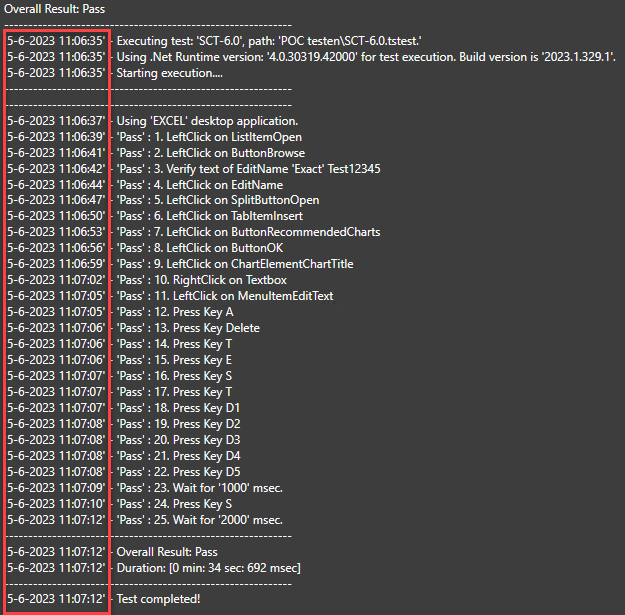
If we get into Test Studio and testing, we can clearly see all results and the overview is amazing! But what is missing, is the function to see the duration of tests in a visual format (an graph or line). What we also discovered is that in the log of every test that has run, the data is there. On every individual step also! So all the data is there to get it into a grapgh/line (in the reports tab).
At this point this is not yet into your product, and for the organisation this is a make or break. I want to address that everything else of the tool is amazing and we would love to take your product if this function gets implemented.
I hope this feature gets implemented and I would like to hear from you.