I have a number of tests scheduled to run every night.
I Selected one of the scheduled tests and made a clone from it, wich i also renamed. The cloned version was edited, half of the test cases was removed.
For the comming scheduled tests my original test with correct name is listed. When i analyzing the result it shows that only the test cases remaining in the new cloned version has been running. So for some reason it seems that wrong testlist has been choosen.
When Daylight Savings Time ended on November 6, our scheduled tests started running an hour earlier than scheduled. I had to "edit" each schedule (without actually changing any settings) and save in order for the time in the "TimeToRun" setting in the job details file to adjust for the time change. It would be nice if this could happen automatically. Or maybe add a right-click option to for updating the time or something.
We would like to request official support for .NET 10 and .NET 11 in Telerik Test Studio to ensure compatibility with upcoming framework versions.
.NET 10 was announced in Nov 2025: Announcing .NET 10 - .NET Blog
The Preview for .NET 11 is available since Feb 10th. .NET 11 Preview 1 is now available! - .NET Blog
Currently Test Studio projects target .Net Framework 4.7.2 to 4.8.
That means our test project has to be .Net framework in order to consume the framework dlls[ArtOfTest.WebAii, ArtOfTest.WebAii.Design].
We are really looking to migrate our test project to .Net core in-order to align with our application under test (that is .Net core).
is there any option to change this ugly user interface in test studio (and its plugin to Visual Studio too) where list of available coded methods is very hard to read? There is huge space available on the screen to make this dropdown very wide (auto-scaling to see full names is good idea here), but despite that this list is very narrow, and then reading & selecting proper method is extremally uncomfortable for developer.
regards
Michal
Test Studio built-in workflow for PDF validation requires the file to be downloaded and then opened in new tab.
Allow the opposite scenario where the user wants to directly open the PDF file in the browser instead.
Note: That way the opened file will not be readable from within Test Studio and only connecting to and closing the new tab will be supported.
Use the demo page on Kendo jQiery TreeView component to move the items between the sections with a drag&drop step recorded in Test Studio.
The so recorded test works fine for Edge and headless Edge and Chrome.
But fails when executed in Chrome.
------------------------------------------------------------
Failure Information:
~~~~~~~~~~~~~~~
ExecuteCommand failed!
InError set by the client. Client Error:
Protocol error (Input.dispatchKeyEvent): Invalid 'text' parameter
BrowserCommand (Type:'Action',Info:'NotSet',Action:'RealKeyboardAction',Target:'null',Data:'keyDown#$TS$#INVIO',ClientId:'xxx',HasFrames:'False',FramesInfo:'',TargetFrameIndex:'-1',InError:'True',Response:'Protocol error (Input.dispatchKeyEvent): Invalid 'text' parameter')
InnerException: none.
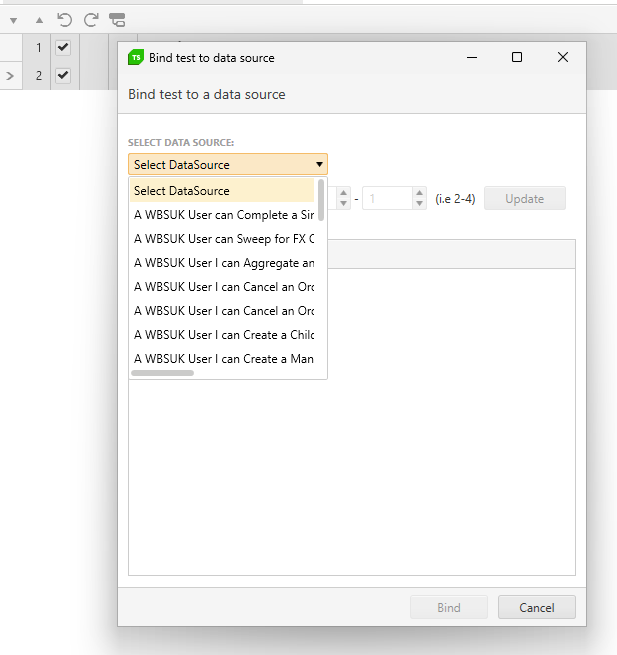
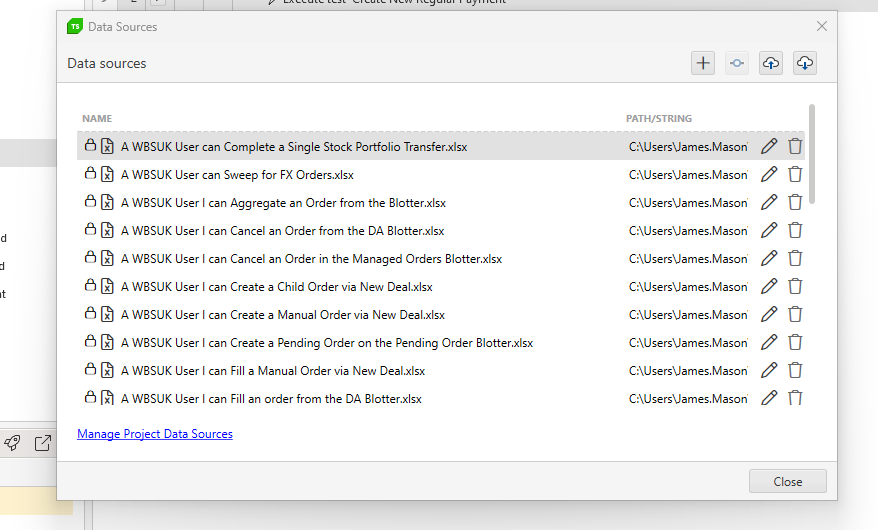
Currently, with lots of bound data sheets the visibility when binding them is poor. See
Can this be improved by widending the view and also making this a search rather than a drop down as the selection will likely grow greatly making it even harder to locate the file i need.
In addition, when managing the data, there should also be a search to filter the data source i want to edit / manage
Hello people at Telerik,
Is it possible to Data Bind a Radmaskedtextinput using the Test Studio User Interface?
In more detail:
I am automating a WPF application (Data Driven).
I want to fill out forms with multiple types of input fields (like Date, Comboboxes and also Radmaskedtextinput).
I have bound my test to an Excel file.
For fields like comboboxes and dates I am able to select the data to be used by clicking on the button "Data Binding" in a test step.
For me, this is "using the Test Studio Interface". (See Databind_combobox)
For "Radmaskedtextinput" type fields I am not able to do this. Clicking on the dropdown arrow at the right of a recorded test step shows nothing. (See Databind_radmaskettextinput)
Workaround:
I am able to data bind the step by converting the teststep to a coded step and changing the argument of the TypeText function. (see Databind_Code). This works, but selecting through the test Studio UI seems easier.
Thanks in advance!
With friendly regards,
Robert
I am trying to capture the image of WPF application's Dialog using Bitmap actualBmp = element.Capture(); like one below
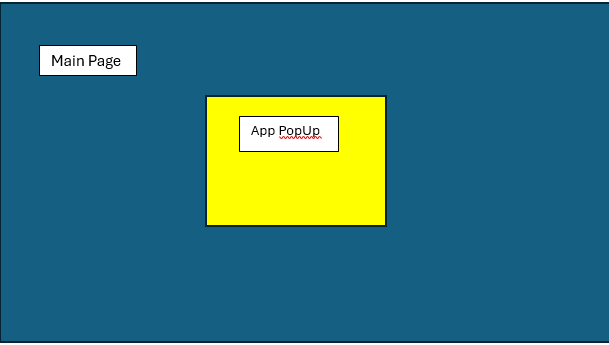
yellow color refers to the actual dialog and other colour refers to the main page of the application.
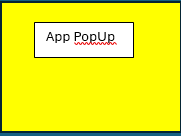
But it returns something like below (Image of the main page with the actual size of the dialog)
I want something like below to be captured
Currently Test Studio Execution extension allows to get the duration only of the overall test in the OnAfterTestCompleted() method.
Extend the functionality and include the option to get the duration of each separate executed step.
Steps to reproduce:
- Use Chrome without extension, or headless mode.
- Use the press key combinations Shift+End and Shift+Home in a coded step and be sure to set focus to a text field.
ActiveBrowser.Desktop.KeyBoard.KeyPress(Keys.Shift | Keys.End);
ActiveBrowser.Desktop.KeyBoard.KeyPress(Keys.Shift | Keys.Home);
Expected: The combination selects the text in the field
- if the cursor is at the begining of the line use Shift+End;
- if the cursor is at the end of the line use Shift+Home;
Actual: The cursor only moves without selecting the text.
Workaround: Use the key combination Shift+A to select the text.
Dear Telerik team,
we lately encountered an inconvenience in using ArtOfTest.WebAii.Win32.SaveAsDialog.CreateSaveAsDialog(params).
The issue occurs in the SaveAsDialog.Handle() method. In there the keyboard input uses fixed parameters for delay and hold: _desktopObject.KeyBoard.TypeText(_filePath, 50, 50, supportUnicode: true);
This slows our test unnecessarily down, so it would be desirable to either change the input parameters to a reasonably short time (Why not 0,0?) or give the developer the option to manually change the parameters, since there is no need for these delays in automated tests.
Best regards
Steps to reproduce:
- Create a test list with 4 tests.
- Each test executes more than 300-350 steps in overall because it is data driven.
- Run the test list remotely/scheduled.
- The generated result is uploaded in the Storage database and is visible in the Test Studio Results tab.
- Open the Executive Dashboard and try to open the runs for the same test list.
Expected: The test results to be displayed.
Actual: The view is empty with the message: "There are no test results for this run."
Workaround: Split each test into a separate test list.
Log on the machine where the Executive Dashboard is hosted shows below error.
Telerik.TestStudio.ResultsServer.exe(7192:313),Error] CloudStorageRepository`2.ExtractItemsFromResponseAsync() : Error getting entity: Telerik.TestStudio.Interfaces.Storage.IStorageDocument`1[[ArtOfTest.WebAii.Design.Repository.LightRunResultSingleTestTransport, ArtOfTest.WebAii.Design, Version=xxxx, Culture=neutral, PublicKeyToken=xxxx]], from url: http://xxxxx/v1/results?includeDeleted=xxx&skip=xxx&take=xx&schema=xxx
Telerik.TestStudio.ResultsServer.exe(7192:313),Error] CloudStorageRepository`2.ExtractItemsFromResponseAsync() :
{"Message":"An error has occurred.","ExceptionMessage":"Command aggregate failed: Sort exceeded memory limit of 104857600 bytes, but did not opt in to external sorting. Aborting operation.


