Need More Info
Last Updated: 15 Sep 2025 15:53 by ADMIN
James Glinsek
Created on: 18 Aug 2025 13:48
Category: Reporting
Type: Bug Report
0
Excel/Word/Powerpoint graph export is incorrect (while PDF works properly)

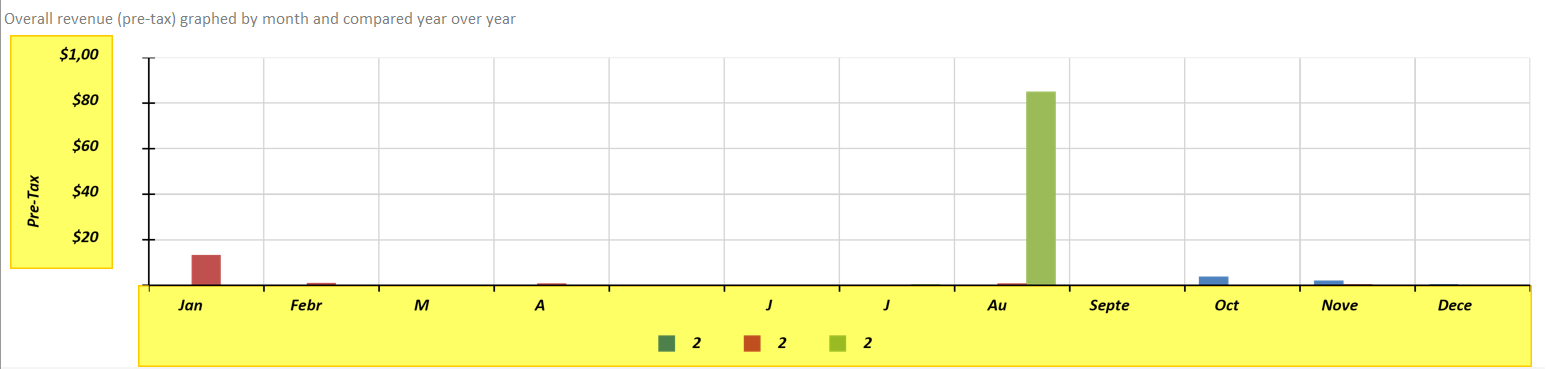
Graphs do not render captions and labels properly when exporting to Excel, Word, or Powerpoint. The problem appears to be worse using Skia on Linux, but the problem is present with GDI rendering as well. Worth noting that PDF export works properly. 

Here is an example report exported to Excel via a Linux Azure Web App and below that is the exact same report from the same environment as PDF:

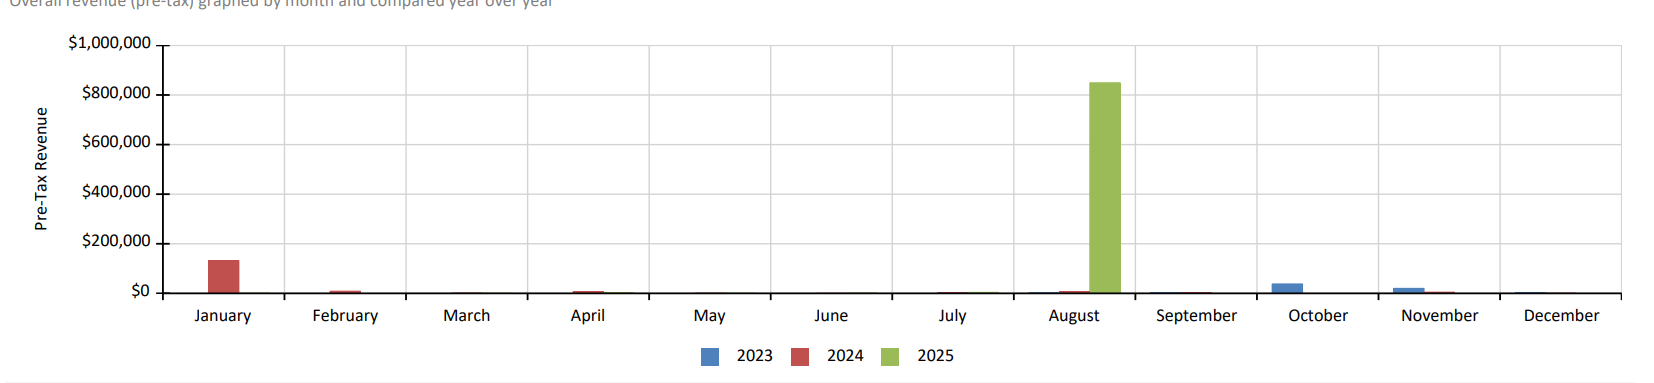
Here is that same report as a PDF (which mirrors how it looks in the HTML5 viewer):


7 comments
ADMIN
Dimitar
Posted on: 15 Sep 2025 15:53

Hello James,

Thank you for the updates!

I tried to reproduce the described issues using our Docker Samples. I tested with the Arial font as well.

I was able to reproduce the issue with the width of the textbox items. This is a known problem that occurs during the conversion of units. For example, the sizes of the items in the report may be set to inches, and for the HTML5 rendering, they get converted to pixels, which can sometimes lead to the last letter of the text being cut off. The recommended way to deal with those scenarios is to set the widths of the textbox items in px to ensure that their size will remain consistent. In my test, I reproduced the issue even when the bold font was last, using your "privateFonts" configuration, and the issue was still present. Those are generally edge cases, but I will talk with the development team to see if we should add an item for this, and I will update you.

The issue with the graph I was unable to reproduce, however.  I used your configuration with the bold font being last, but the issue did not reproduce. The graphs were rendered with the regular Arial font. Would it be possible to share a sample project with us where the issue reproduces so that the development team can debug it? Or even better, see if you can reproduce the issue with our Docker Samples, and if you can, send us an edited version of one of the sample projects.

With that being said, if there is an issue, it would likely be a duplicate of the Excel export with Skia renders the text in the Graph with bold font, although it is set as regular in the report item, based on what you have found and shared. I will speak with the development team to try and prioritize the other item.

In the meantime, the issue may be caused by loading those fonts as private fonts. There are currently other bugs related to loading fonts with the "privateFonts" element. What I would recommend doing while the above bug is fixed is to try installing the fonts on your Linux server instead of using them via the "privateFonts" element. By installing, I mean putting the fonts into usr/share/fonts, which you can do even in Docker containers using commands like docker container cp.

Please remove the privateFonts configuration, and try using globally installed fonts, then let me know how it goes..

Regards,
Dimitar
Progress Telerik

Love the Telerik and Kendo UI products and believe more people should try them? Invite a fellow developer to become a Progress customer and each of you can get a $50 Amazon gift voucher.

James Glinsek
Posted on: 11 Sep 2025 16:59

Ok, one final comment after switching to Arial. We landed on the following:

```

    "privateFonts": [
      {
        "fontFamily": "Arial",
        "path": "ARIAL.TTF"
      },
      {
        "fontFamily": "Arial",
        "path": "ARIALBD.TTF",
        "fontStyle": "Bold"
      }
    ],

```

  1. TextBoxes in reports will render "ok" with just the ARIAL.TTF regular font. However, in the HTML5 report viewer, if you have a textbox with a bolded font, the width will be calculated incorrectly and text can be cut-off. By putting the bold font last, it seems to use Bold when calculating widths which makes the bold textboxes work and doesn't seem to negatively impact non-bold textboxes.
  2. Whatever font is last is the ONLY font use to render ANY text on charts and graphs. So, even if you have regular or italics on labels or legends or captions, it just uses Arial Bold without any italic on all text. 
  3. What feels odd (and why this has been so hard to completely track down) is that bold, italic, and regular Arial text all seem to render fine in textboxes/tables (with the exception of the width calculations in the HTML5 viewer) in the HTML5 viewer and on exported reports.
James Glinsek
Posted on: 11 Sep 2025 13:57

Hey Dimitar, 

In further testing, what I've found is:

  1. You cannot specify multiple styles of a font in your private fonts. It just doesn't seem to work or make any difference. The only one that is ever used is the last one listed that matches the name of the font used on the report.
    1. So, in the case where I specified 4 fonts with specific names (none of which were just "Calibiri"), the tracing indicated that Calibri couldn't be found and reverted to Deju Vu Sans (on Linux) - although in the HTML5 viewer, Calibri was used sporadically throughout the report.
    2. If I give them all a fontFamily of "Calibri" then the HTML5 viewer looks great, but exporting graphs seems to just use the last font in the list (hence in my screenshots, the graphs were using Bold+Italic - the last one in the list). See this duplicate bug report: https://feedback.telerik.com/reporting/1686068-excel-export-with-skia-renders-the-text-in-the-graph-with-bold-font-although-it-is-set-as-regular-in-the-report
  2. If I ONLY include a single font, Calibri Regular, and give it a fontFamily of "Calibri", the HTML5 report viewer renders the report fine, but exporting is still broken because apparently Linux and Calibri just don't get along? 🤷
  3. Some other fonts seem to work ok, especially fonts that come with only a single font file. Examples include Noto Sans, Arial, Tahoma, and Times New Roman. 
James Glinsek
Posted on: 09 Sep 2025 20:46

Hey Dimitar,

Ok, I went through this again, and I think I might have crossed some wires in my last response. In that post, the correct screenshot is using Arial as you noted. However, I think the incorrect screenshot is using Calibri (which is the font I've been trying to use for reports). 

So, what I'm finding is that when using a font like Calibri, which has 4 different font files (Regular, Bold, Italic, Bold+Italic), things don't export properly on Linux. And they don't export properly on Windows/Skia unless you list the fonts in a particular order. 

Currently, our privateFonts section looks like this (and this produces the bad results shown in both my original screenshots and the contrived graph-test.trdx example on both platforms):

```

    "privateFonts": [
      {
        "fontFamily": "Calibri",
        "path": "Fonts/CALIBRI.TTF",
        "fontStyle": "Regular"
      },
      {
        "fontFamily": "Calibri",
        "path": "Fonts/CALIBRII.TTF",
        "fontStyle": "Italic"
      },
      {
        "fontFamily": "Calibri",
        "path": "Fonts/CALIBRIB.TTF",
        "fontStyle": "Bold"
      },
      {
        "fontFamily": "Calibri",
        "path": "Fonts/CALIBRIZ.TTF",
        "fontStyle": "Bold, Italic"
      }
    ],

```


If I change it to the following, it actually starts to work properly on Windows/Skia, but it still does NOT work on Linux:

```

    "privateFonts": [
      {
        "fontFamily": "Calibri Bold",
        "path": "Fonts/CALIBRIB.TTF",
        "fontStyle": "Bold"
      },
      {
        "fontFamily": "Calibri Regular",
        "path": "Fonts/CALIBRI.TTF",
        "fontStyle": "Regular"
      },
      {
        "fontFamily": "Calibri Italic",
        "path": "Fonts/CALIBRII.TTF",
        "fontStyle": "Italic"
      },
      {
        "fontFamily": "Calibri Bold Italic",
        "path": "Fonts/CALIBRIZ.TTF",
        "fontStyle": "Bold, Italic"
      }
    ],

```


NOTE, the `Fonts` folder is distributed with our app.


Am I doing something wrong with defining those fonts? Or does this just not work on Linux? Note the order DOES matter for Windows/Skia (I didn't fully vet that out, but when I had the Regular font first, I still got weird results, moving it to the 2nd item in the list allowed me to render all 4 styles of fonts). Again, in Linux, no matter what order I use and no matter what I put in the fontFamily field, I get bad results. 

ADMIN
Dimitar
Posted on: 29 Aug 2025 15:15

Hi James, 

Thank you for the sample report and the additional information!

I tried exporting this report locally on a Windows 11 machine in an ASP.NET Core application targeting .NET 9, both with the GDI and Skia engines, but the results were similar(though not fully the same), and problematic behavior did not reproduce.

We render the graphs as Metafiles(EMF) in the Excel document - Excel Rendering Design Considerations at a glance - Telerik Reporting, so it is possible they may be affected by the DPI settings of your monitor. What DPI do you use? I tested with 125% and 150% monitor scaling, but both results were correct.

Can you test with another DPI setting? If that turns out to be the problem, you can make the application DPI-aware using the "dpiAware" setting - dpiAware Element Configuration - Telerik Reporting. For example:

"telerikReporting": {
    "dpiAware": {
        "dpiAwareness": "PROCESS_SYSTEM_DPI_AWARE"
    }
}

Also, it should be a given, but can you confirm that the fonts used in the report, which seem to be the "Arial" font, are installed on the computer?

Please test the above suggestions and let me know how it goes. If that does help, please consider sending us a runnable project with the issue so that we can investigate it.

Regards,
Dimitar
Progress Telerik

Love the Telerik and Kendo UI products and believe more people should try them? Invite a fellow developer to become a Progress customer and each of you can get a $50 Amazon gift voucher.

James Glinsek
Posted on: 25 Aug 2025 15:04

Hey Dimitar,

So, the problem is that the export from the stand-alone designer does NOT match up to the export from a .NET Core application. And the problem is worse when that .NET Core application is run on Linux. 

So, I took the report you shared and I modified it slightly to more closely match my report:

  1. Added "Titles" on the X and Y axis.
  2. Modified the data to take in an actual date (rather than a string)
  3. Modified the grouping on the X axis to group by Month name (like my report does).

When I export that from the stand-alone designer, it looks like it looks on screen (in either Skia or GDI mode). Like this:


However, when I run it through my app (again, an asp.net core app on my Windows 11 development machine, but running via the Skia engine) and export it (via the HTML5 report viewer), then I get output that looks like this:

In this contrived example, I've highlighted in yellow how the side caption (Title) and the X-axis labels get randomly messed up. Again, this is done via my Window 11 development machine in an asp.net core web app exporting to Excel through the HTML5 report viewer interface. If I could deploy this to my Azure App Host (which runs on Linux), I suspect the output would likely be a bit worse. 

I've attached my modified report and exports from the stand-alone designer and from the asp.net core app.

Attached Files:
ADMIN
Dimitar
Posted on: 25 Aug 2025 11:33

Hi James,

Thank you for the provided information about the scenario!

I tried to reproduce the issue locally by rendering a report with a column chart using the Skia engine through the Standalone Report Designe for .NET. However, I did not observe the described problem in any of the OpenXML formats.

I have attached a zip with the sample report I used for the tests, as well as the generated Excel, Word and PowerPoint documents.

Could you please provide more instructions on how to reproduce the issue? Also, can you test and let me know if the issue reproduces with the sample report?

Additionally, a trace log could also help since if there are any errors during the rendering of the report, we should be able to see them in the log - How to troubleshoot errors in ASP.NET Core projects - Telerik Reporting.

I look forward to your response.

Regards,
Dimitar
Progress Telerik

Love the Telerik and Kendo UI products and believe more people should try them? Invite a fellow developer to become a Progress customer and each of you can get a $50 Amazon gift voucher.

Attached Files: