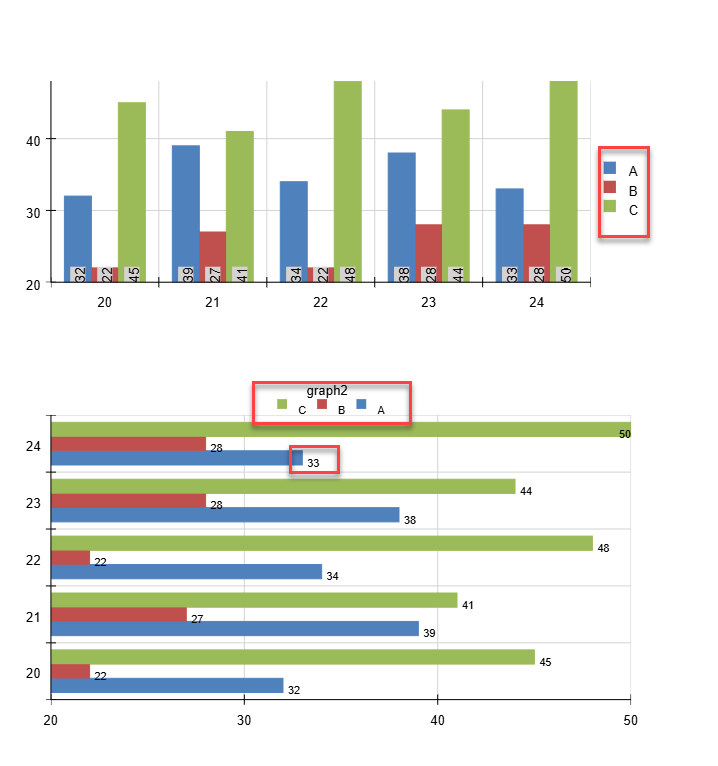
I have graphs in my report. I render them with Skia on Linux. The issue reproduces with Skia on Windows as well.
The legend labels are not aligned well with the color icon, and data labels on a horizontal bar chart (with OutsideEnd) are misaligned as well:
greetings
Summary
When the Web Report Designer is initialized with non-English string resources (via window.telerikWebDesignerResources), the authentication type selector in the Web Service Data Source wizard behaves incorrectly. Even though "Sin autenticación" (the translated value of WebServiceDataSourceNoAuthentication) is visually selected in the dropdown, the wizard behaves as if a different authentication type is selected — displaying additional required credential fields and blocking progression.
The issue does not occur when using English string resources (WebServiceDataSourceNoAuthentication = "No authentication").
---
Steps to Reproduce
1. Configure a Blazor Web Report Designer with Spanish (es-CO) custom string resources using window.telerikWebDesignerResources:
// WebReportDesignerStrings.es-CO.js
export class WebReportDesignerStringsBase {
constructor() {
// ...
this.WebServiceDataSourceNoAuthentication = "Sin autenticación";
// ...
}
}
// Load resources before designer renders
window.telerikWebDesignerResources = new WebReportDesignerStringsBase();
2. Open the Web Report Designer in the browser with the Spanish resources active.
3. Add a new Web Service Data Source.
4. In the wizard URL step, observe the authentication selector — it shows "Sin autenticación" as the selected option.
5. Attempt to proceed through the wizard.
---
Expected Behavior
With "Sin autenticación" selected (equivalent to "No authentication"), the wizard should:
- Require only the Service URL field
- Not display credential input panels
- Allow proceeding to the next step without authentication configuration
---
Actual Behavior
Despite "Sin autenticación" being visually selected, the wizard behaves as if a different authentication type (Basic or 2-step) is selected:
- Additional authentication configuration panels appear or are required
- The wizard blocks progression expecting credential inputs
- The behavior is identical to what occurs when "Basic" or "2-step" is selected
---
Root Cause Analysis
The designer's compiled JavaScript (webReportDesigner) appears to compare the selected authentication type against the English string "No authentication" internally, rather than against a stable enum or index value. When the display text is "Sin autenticación", this comparison fails and the wizard falls through to a non-"no auth" code path.
Evidence: applying the temporary workaround of keeping WebServiceDataSourceNoAuthentication = "No authentication" (English text) in the es-CO resources file resolves the issue completely — the wizard functions correctly while all other strings remain in Spanish.
---
Workaround
In the non-English string resources file, keep WebServiceDataSourceNoAuthentication in English:
// workaround: keep English value until Telerik fixes internal comparison
this.WebServiceDataSourceNoAuthentication = "No authentication";
---
Minimal Reproduction
@* ReportEditor.razor *@
@page "/reportEditor"
@using Telerik.WebReportDesigner.Blazor
<WebReportDesigner DesignerId="wrd1"
ServiceUrl="apiReport/reportdesigner" />
// Loaded before designer renders via IJSRuntime.InvokeVoidAsync
window.telerikWebDesignerResources = {
WebServiceDataSourceNoAuthentication: "Sin autenticación",
// ... other keys
};
---
Additional Notes
- Both es-CO and en-US string resource files contain 971 keys each — the issue is not caused by missing keys.
- The designer correctly picks up the localized strings for all other UI elements; the bug is isolated to the authentication dropdown value comparison logic.
- Confirmed on version 19.1.25.521; not tested on earlier versions.
thank for your attention.
have a nice day.
I use the exportBegin event to prevent the default export logic. However, when I do that, the default viewer notification remains, and I have to hide it manually:
                    exportBegin: function (e, args) {
                        args.handled = true; // Set to true to cancel the default export behavior.
                        //...
                        $(".trv-notification").addClass("k-hidden");
                    },
When a report is saved in the Web Report Designer, a popup appears confirming that the report was successfully saved. However, it is visible for far too long and blocks users during this time.
This feature request is to add an 'ok', 'hide' or 'close' button to these types of popups so the user can dismiss it.
Thank you,
Shannon
Hi there,
Adding an external style sheet to a report in a report-book triggers an error when previewing the report book, "Object reference not set to an instance of an object"
I've attached the bare minimum project to reproduce the error.
I've also tried upgrading to R3 2020
Cheers
In my Graph, I have set the AccessibleRole and AccessibleDescription. The alternative text is read correctly by the Acrobat Reader's 'Read out Loud' functionality.
The problem is that it keeps reading it multiple times.
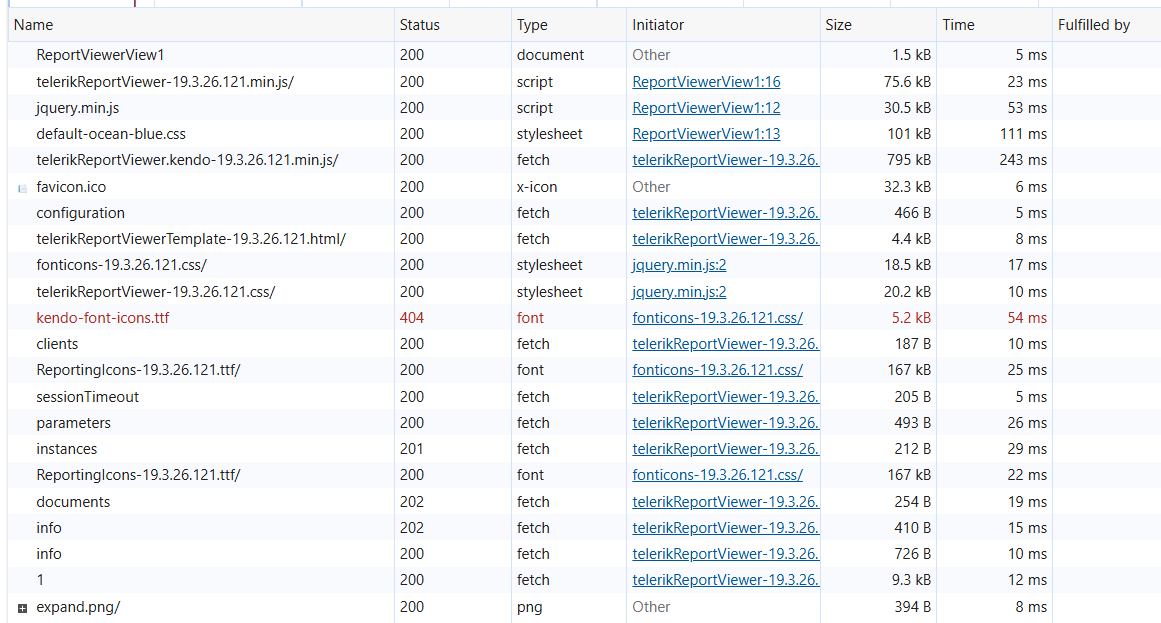
The HTML5-based report viewers send 404 request to `/sass/fonts/kendo-font-icons.ttf` when font icons are being used:
When using screen reader applications like JAWS or Narrator, those tools read accessible reporting PDFs in an incorrect order. For example, if I have two items in the report, the reader will read the second item first.
Additionally, images whose AccessibleDescription I have set may be read multiple times..
When I display a report in a web report viewer, whose service is running on a server where one or more of the used fonts are not available, the first instance of the item(s) that use those fonts is being substituted with another font. The rest of the items do render with the original font, however.
This creates confusion and inconsistency. We should use the substituted font because it's used for measuring when using Print Preview mode in the web viewers, or when rendering to pdf via print/export.
However, in my report, the Interactivity options do not show any property for Level. I am only seeing basic properties like Action, BookmarkId, DocumentMapText, TocText, etc.
The Level field is completely missing.
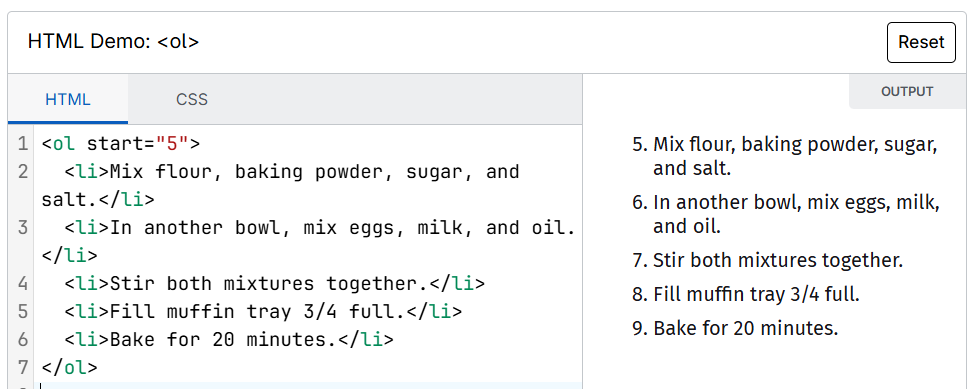
Consider adding support for the `start` attribute of the `ol` element in HtmlTextBox. This would allow us to change the start counting:
The HTML5 Report Viewer uses inline templates which may require enabling the unsafe-eval CSP policy.
The viewer should migrate to using CSP templates as shown in Getting Started with Content Security Policy (CSP) Templates - Kendo UI Templates - Kendo UI for jQuery.
When exporting an SVG image to PDF, polylines with stroke-dasharray are rendered incorrectly — the dash pattern is not applied.
Additionally, polylines with a stroke-width exhibit visual artifacts such as pixelation or inconsistent thickness.
Step by step instructions or code snippets how to reproduce the problem
- Save svg content (see below) as a file c:\test_svg_line_stroke.svg
- Create an empty report
- Add a picture box
- Select a value for the picture box - use file c:\test_svg_line_stroke.svg
- Go to preview - SVG is correct
- Click Export->Acrobat (PDF) file and export a PDF file
- Open PDF file to verify that the red line in a bottob does not have stroke-dasharray applied
If there's no black line with no stroke-dasharray - the red line in a bottom looks correct
test_svg_line_stroke.svg
<svg version="1.1" xmlns="http://www.w3.org/2000/svg" xmlns:xlink="http://www.w3.org/1999/xlink" xmlns:xml="http://www.w3.org/XML/1998/namespace" width="500" height="400" viewBox="0, 0, 500, 400" preserveAspectRatio="xMinYMin" transform="scale(1)">
  <polyline points="100, 100 400, 100" stroke-width="7" stroke-dasharray="40 40" style="fill:none;stroke:#FF0000;" />
  <polyline points="100, 200 400, 200" stroke-width="5" style="fill:none;stroke:#000000;" />
  <polyline points="100, 300 400, 300" stroke-width="7" stroke-dasharray="40 40" style="fill:none;stroke:#FF0000;" />
</svg>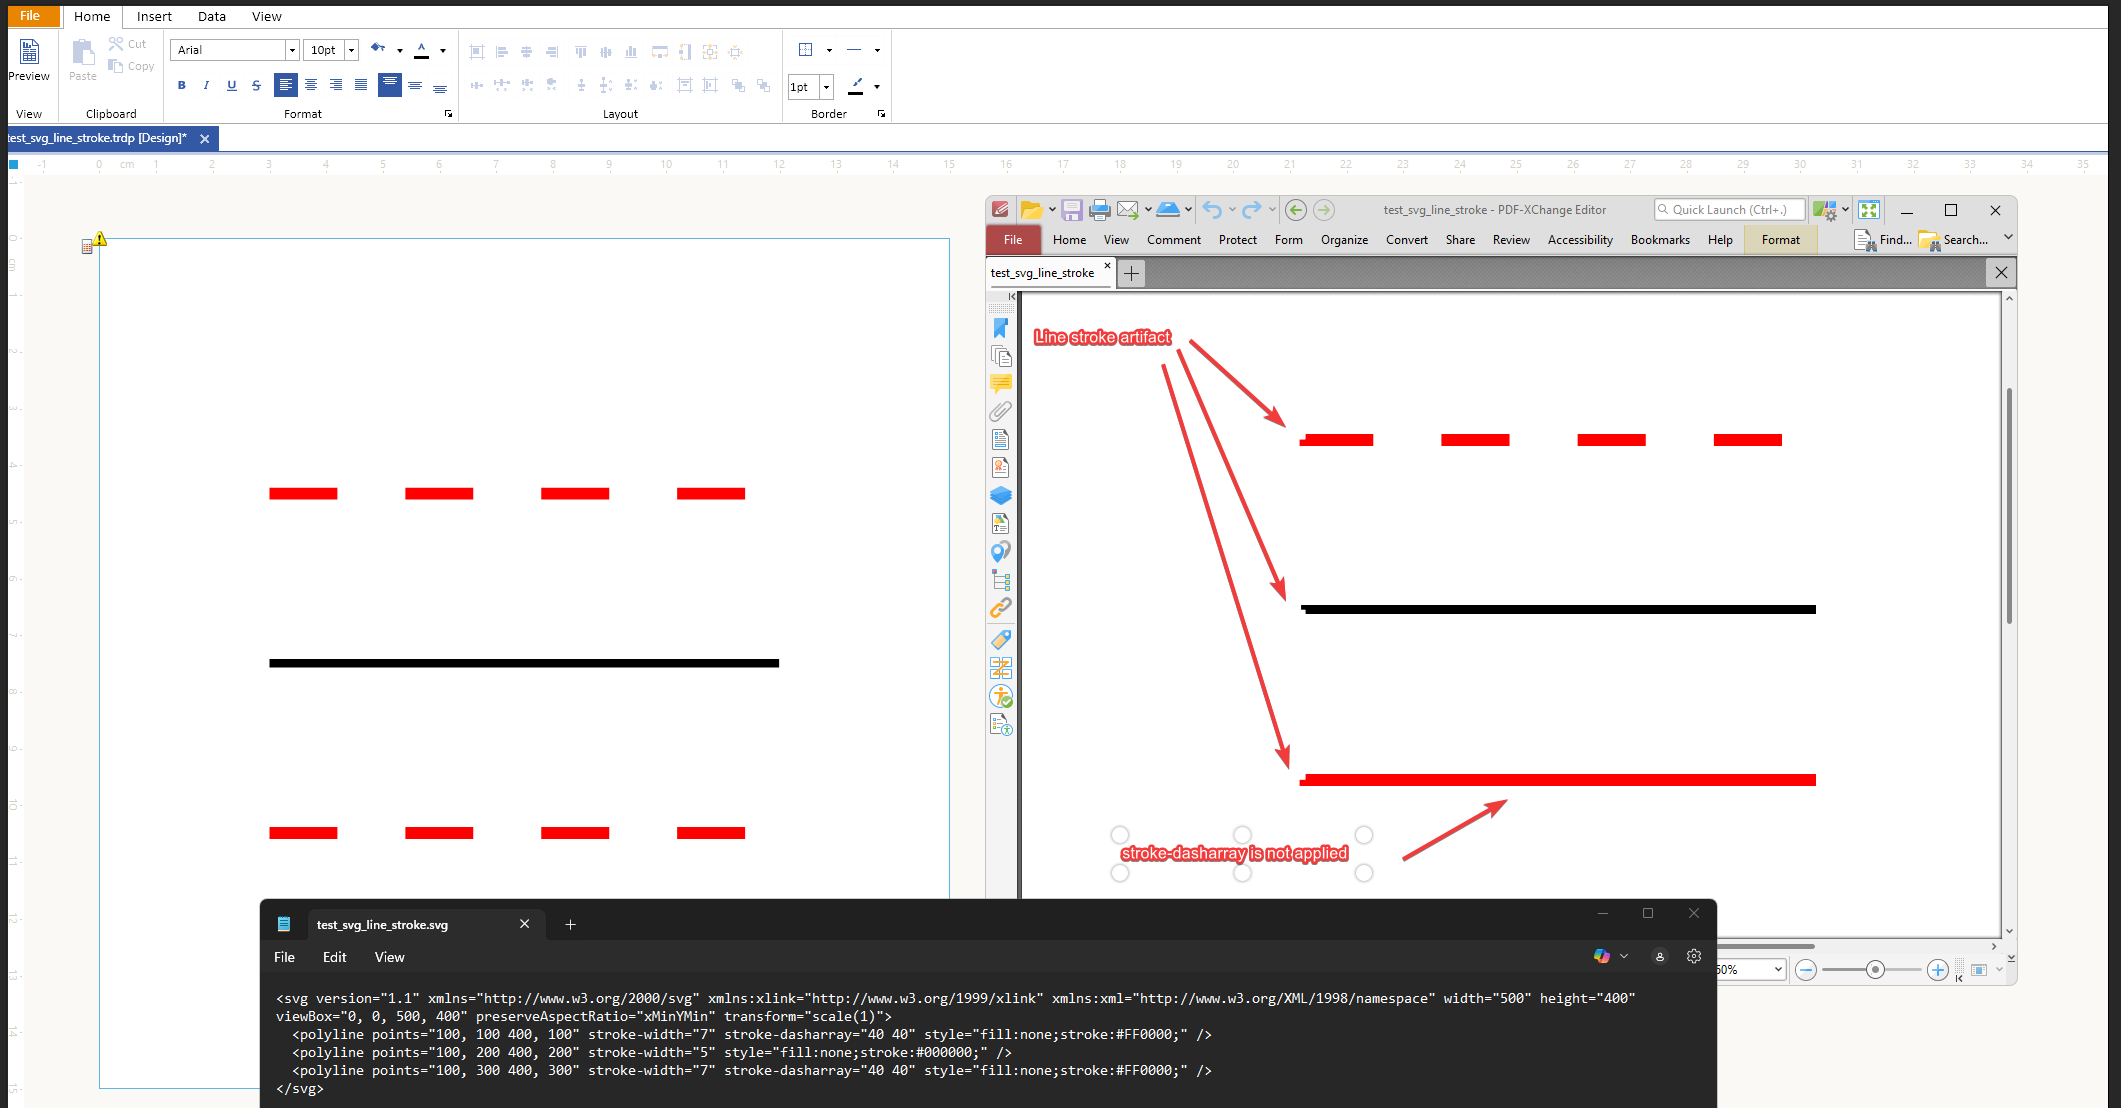
test_svg_line_stroke.svg - svg source file
test_svg_line_stroke.trdp - report with a picture box with SVG image
test_svg_line_stroke.pdf - generated PDF file