Currently, when you set SplitWorksheetOnPageBreak to True, the Excel Sheet name is formed from the DocumentName or ReportName and the number of the page.
It would be very helpful if the report authors can manipulate these names with Expressions.
Double-click selection in the expression editor isn't context-aware. In almost every other application, double-clicking selects a token based on its surrounding context — a single field/identifier when clicking on a field, or the word boundary within a string literal when clicking inside quotes. The expression editor doesn't respect these boundaries, so its double-click behaviour is inconsistent with the standard expression-editor behaviour users expect.
Expected: Double-click selects the relevant token based on context (e.g. an individual field reference, or a word within a string literal).
Actual: Double-click selection ignores context and does not match the token/word-boundary behaviour found in virtually all other expression editors and text inputs.
It would be great if you could introduce the ability to create custom reusable color palettes in Telerik Report Designer, so I don't have to declare the same set of colors for each chart I need them.
If you have a lot of graphs in your report then it is more convenient to change the color palette one place.
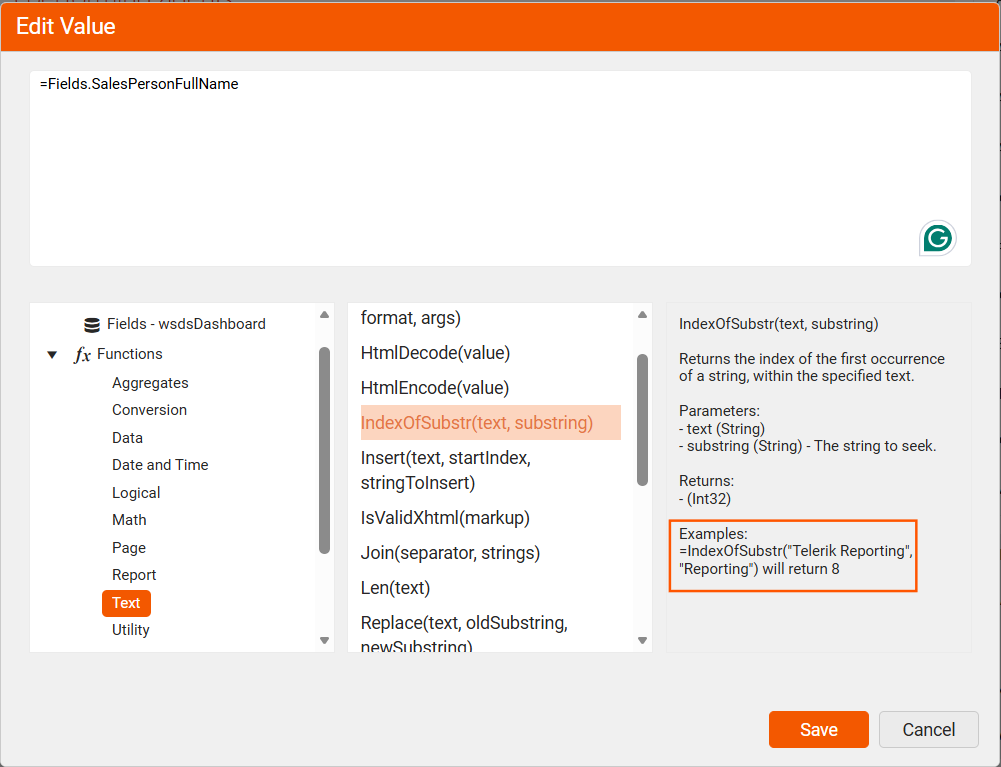
If I open the expression dialog in the Web Report Designer and select one of the available functions, I will see a sample snippet in the third column below the expression area.
This column is not selectable, so I cannot copy the example and test it out. This example should be copyable, so that each function can be easily tested in the report designer.
Request:
Add a RedisStorage constructor overload that accepts StackExchange.Redis.IConnectionMultiplexer rather than only the concrete ConnectionMultiplexer.
Current behavior:
new RedisStorage(ConnectionMultiplexer connectionMultiplexer) requires the concrete type.
Problem:
Modern ASP.NET Core apps manage a single shared multiplexer through DI and expose it as IConnectionMultiplexer — the abstraction recommended by StackExchange.Redis, and the same type
Microsoft.Extensions.Caching.StackExchangeRedis uses via its ConnectionMultiplexerFactory (which returns IConnectionMultiplexer). To call RedisStorage we are forced to downcast our IConnectionMultiplexer back to
ConnectionMultiplexer. This is fragile and it prevents passing test doubles or decorators (e.g. for instrumentation/logging).
Proposed change:
Add RedisStorage(IConnectionMultiplexer connectionMultiplexer), plus a databaseNumber overload (RedisStorage(IConnectionMultiplexer connectionMultiplexer, int databaseNumber)). ConnectionMultiplexer already
implements IConnectionMultiplexer, so this is fully backward-compatible — existing callers that pass a concrete instance keep working unchanged. Everything RedisStorage needs is available on the interface
(GetDatabase for string operations and LockTake/LockRelease, GetSubscriber, GetServer).
Benefits:
- Clean dependency-injection integration with a shared, app-managed multiplexer.
- Unit-testability via a mocked IConnectionMultiplexer.
- Consistency with StackExchange.Redis guidance and Microsoft's own caching abstractions.
Note:
Please target the maintained Telerik.Reporting.Cache.StackExchangeRedis package (the .2 variant appears discontinued after 18.2.24.806 and has no 19.x/20.x release).
We have spotted that PInvoke is now marked as deprecated (this applies even to the latest 0.7.124 version). In the description of the PInvoke.User32 NuGet package, it is mentioned that Microsoft.Windows.CsWin32 should be used instead:
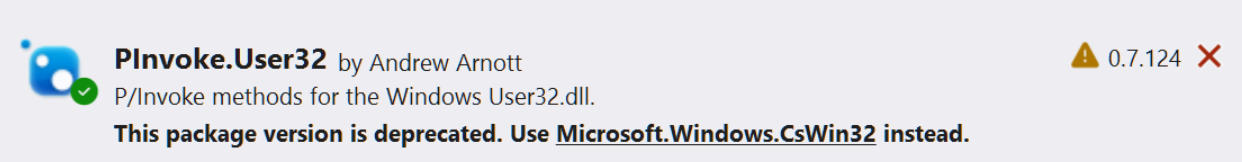
Please consider replacing the deprecated package.
However, in my report, the Interactivity options do not show any property for Level. I am only seeing basic properties like Action, BookmarkId, DocumentMapText, TocText, etc.
The Level field is completely missing.
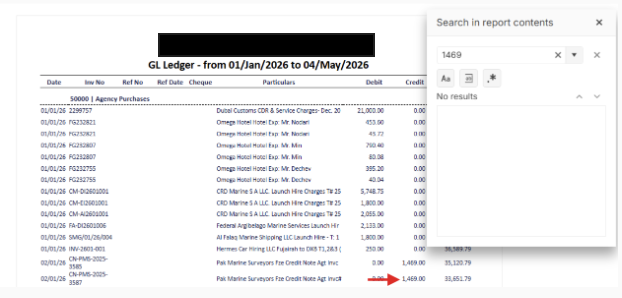
Currently, the search functionality in the Report Viewer only matches the exact text as it is displayed on the screen. For example, if a value is formatted as "1,469", searching for "1469" yields no results.
I would like the search functionality to work against the underlying data value. Users should be able to find numeric values even if they don't include the thousands separator (comma) or other formatting in their search query. This would make the report much more user-friendly and consistent with how users expect search to work.
- Actual Value: 1469
- Displayed Text: 1,469
- Expected Search Behavior: Searching for "1469" should highlight "1,469".
When generating PDF/UA files, we need to have special objects that are read by an internal system but ignored by screen readers. This cannot be achieved with the existing functionality.
It would be beneficial if we could configure reports so that specific objects inside the generated document are ignored by screen readers. For example, by setting a special value to the AccessibleRole property of a text box.
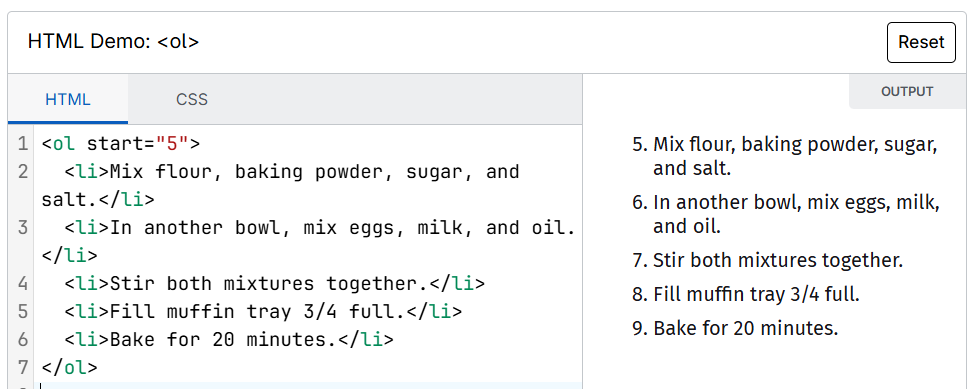
Consider adding support for the `start` attribute of the `ol` element in HtmlTextBox. This would allow us to change the start counting:
The rendering extensions are currently loaded by the Telerik.Reporting.Processing.RenderingExtensionManager all at once in the main thread when the report processing starts. This is redundant because one report processing requires one rendering extension to be loaded.
It would be really useful if EntityDataSouce was updated to support Entity Framework Core contexts. EF Core depends on Standard 2.0 so can run on .NET Core or the full framework.
Currently, if I want to see what the device info settings for an extension like the PDF are, I need to open the documentation - Telerik Reporting Configuring the Output Formats PDF Device Information Settings - Telerik Reporting, then copy the setting that I wish to use in my code.
It would be easier and safer if the device information settings for each format were exposed as a public enum/class. On that note, it would also be easier if the available formats were exposed as well, instead of manually typing them. For example:
public static classTelerikDeviceInfoSetting
{
    public static class PDF
    {
        public const string DOCUMENTTITLE = "DocumentTitle";
        public const string DOCUMENTAUTHOR = "DocumentAuthor";
        public const string DOCUMENTSUBJECT = "DocumentSubject";
        public const string DOCUMENTPRODUCER = "DocumentProducer";
        public const string DOCUMENTCREATOR = "DocumentCreator";
    }

    public static class XLSX
    {
        public const string USENATIVEPAGEHEADER = "UseNativePageHeader";
        public const string USENATIVEPAGEFOOTER = "UseNativePageFooter";
        public const string SHOWGRIDLINES = "ShowGridlines";
    }
}

public static class TelerikRenderingExtension

{

public const string PDF = "PDF";

public const string XLSX = "XLSX";

}
In the Standalone Report Designer File menu, please add the shortcuts next to menu items, like Ctrl + S for Save and Ctrl+Shift+S for Save All.
I changed several reports and then wanted to know how to save all reports at once.
When I have multiple reports open in the Standalone Report Designer, I am not able to rearrange/reorder them.
Refer to the tab behavior in Visual Studio, where you can drag one tab and move it to be in front of another tab.
At the moment it's only possible to have your reports in old-fashioned projects.
It should be possible to add/design reports to SDK-style projects. That should work no matter what target framework is (.NET Core, .NET Standard or .NET Framework).
Currently, logarithmic axes do not support the LabelStep and MajorStep properties, which makes it difficult to control label density and avoid visual clutter for larger data ranges.
Adding support for these settings (similar to numerical scales), or providing a way to conditionally hide axis labels, would significantly improve readability and axis customization.
Currently, the GetDesignerResource endpoint of the Web Report Designer service is case-insensitive, which can lead to issues if the URL is made lowercase at some point, such as by a URL rewrite rule, or similar scenarios.
For example, the following reference to the Web Report Designer script will load return the file:
<script src="api/reportdesigner/designerresources/js/webReportDesigner"></script>But if lowercase is used, for example, like this:
<script src="api/reportdesigner/designerresources/js/webreportdesigner"></script>The request will return a 404(Not Found) response.
Is there a telerik reporting xml schema definition document somewhere? This is so that we can more effectively get AI to automatically build telerik reports.