Unplanned
Last Updated:
14 Jan 2022 15:53
by ADMIN
Pat
Created on:
27 Apr 2021 05:46
Category:
Reporting
Type:
Feature Request
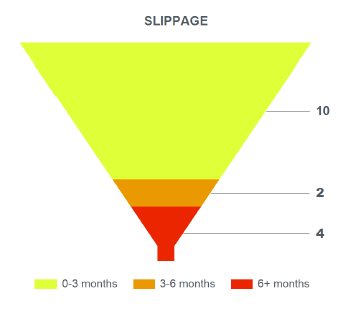
Funnel Chart
It would be really great if there is a Funnel chart.
We are trying to visualize the quantitative slippage in tasks assignment in a given month-range.
We did it very well in SSRS Reporting and as we migrate to Telerik Reporting, we can't quite figure out how to present it.
3 comments
ADMIN
Neli
Posted on:
14 Jan 2022 15:53
Johann
Posted on:
07 Jan 2022 18:06
ADMIN
Neli
Posted on:
27 Apr 2021 12:12