Unplanned
Last Updated: 29 Mar 2021 12:33 by ADMIN
Mario
Created on: 04 Feb 2021 19:07
Type: Feature Request
0
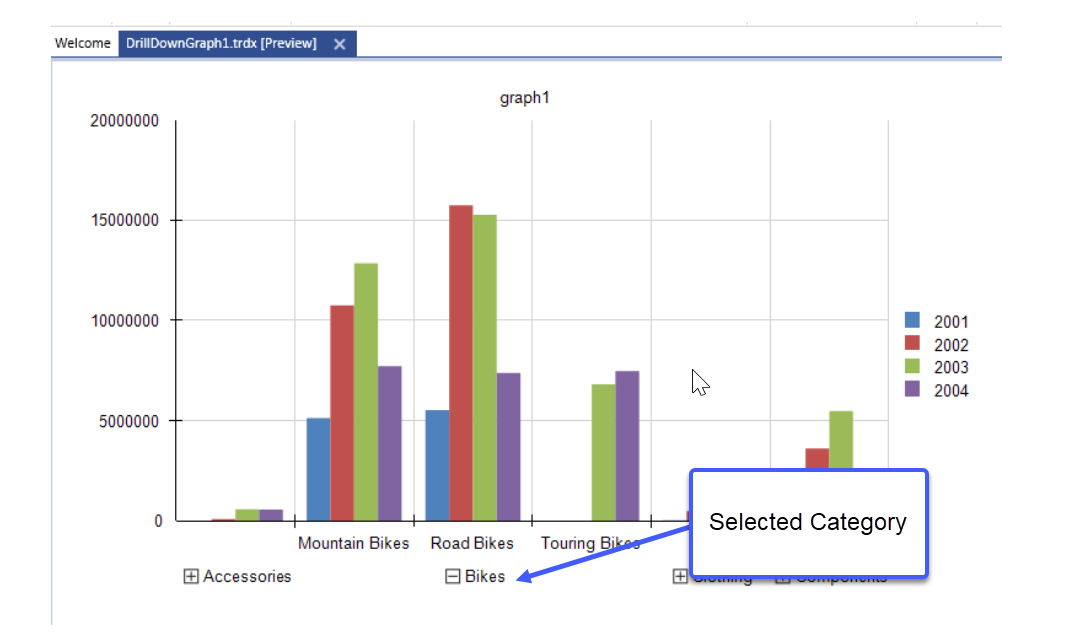
Show/hide individual xaxis column

Now you can do it by grouping several options, but what i want is to hide one by one.


3 comments
ADMIN
Ivan Hristov
Posted on: 12 Feb 2021 13:41

Hi Mario,

Thanks for the additional details about the current scenario. The levels of interactivity are defined by the levels of the category groups, so I'm afraid there is no out-of-the-box solution that allows you to hide or show the whole slot of the innermost category child group. The ToggleVisibilityAction associated with a category group allows to expand or collapse the whole child group and not just some of its items.

Thinking further on this feature, I'm not sure what would be the proper way to display it on the axis. If we only show a + button for the collapsed category slots, the users may get confused trying to understand what this + button stands for, so naturally we should display some label right next to the + button. But this label would need a certain space to be displayed, so basically it still will occupy some area of the axis. Of course, we can rotate the text vertically or use a tooltip, but still we should allocate some space, even when the category is in collapsed state.

Thanks again for taking your time to log and explain this feature request. We keep an eye to the most requested features and schedule them for implementation based on the votes they have. Since you're subscribed to this request, you'll get notified automatically when its status changes.

Regards,
Ivan Hristov
Reporting Team

Mario
Posted on: 05 Feb 2021 22:58
I just want to click for example mountain bikes and hide it individually, so only road bikes and touring bikes is shown, finally instead of mountain bikes, a + button will be shown (like the ones in the bottom for the groups) and we can show it again. Now we only can show/hide by groups (for example bikes, accessories), not for individual column (Mountain bikes).
ADMIN
Ivan Hristov
Posted on: 05 Feb 2021 15:43

Hello Mario,

Thank you for logging a feature request in our portal. We examined it and we would like to ask you to provide a bit more details about the current scenario. In the requirements it is said that you want to hide the data points (columns) displayed on the graph, but it's not clear to us whether you would like to hide the whole slot (like Mountain Bikes) which represents a single category, or just a datapoint (like 2001, 2002, etc.) which represents a single series. If you want to hide the whole category slot, you can use the CategoryGroup's Filter option that will filter out the items that do not meet a certain criteria. The series groups also have Filters property that may be useful in the current scenario.

Also it is not clear if you would like to hide or show the items interactively, i.e. when clicking on an expand/collapse button or somewhere else.

In order to understand the scenario better and provide guidance for a possible workaround, please explain how the graph should look like and how it should respond when hiding/showing any of the displayed data points.

I will change the status of the current item to Under Review until we have more details that will help us understand the scenario. Once we examine these details, we'll follow up with further suggestions. You will be automatically notified for each change of the item' status.

Thank you in advance for your assistance.

Regards,
Ivan Hristov
Reporting Team