Unplanned
Last Updated:
24 Jan 2025 08:12
by Christopher
Christopher
Created on:
24 Jan 2025 08:12
Category:
SpreadProcessing
Type:
Bug Report
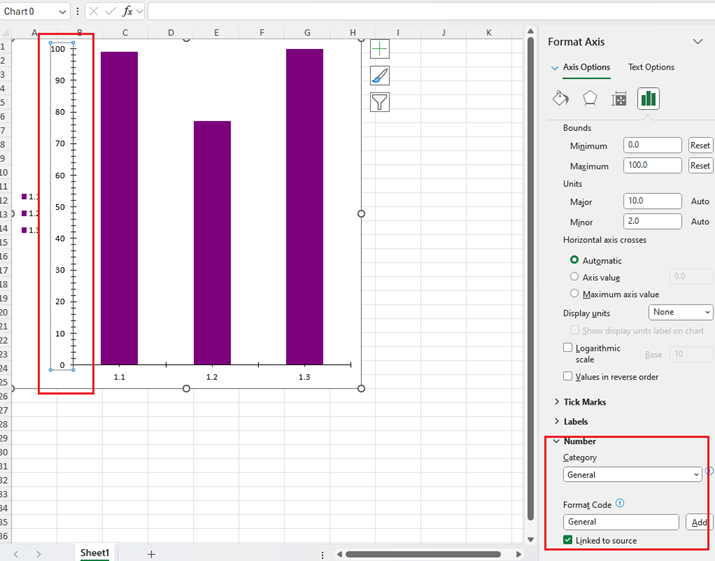
SpreadProcessing: The NumberFormat for the axis is not respected when not data is linked to the chart
Use the following code to create the document:
            Workbook workbook = new Workbook();
            Worksheet graphWorksheet = workbook.Worksheets.Add();
            FloatingChartShape chartShape = new FloatingChartShape(graphWorksheet,
                                         new CellIndex(0, 0),
                                         new CellRange(0, 0, 0, 0), ChartType.Column)
            {
                Width = 500,
                Height = 500,
            };

            graphWorksheet.Charts.Add(chartShape);
            DocumentChart chart = new DocumentChart();
            BarSeriesGroup barSeriesGroup = new BarSeriesGroup();
            barSeriesGroup.BarDirection = BarDirection.Column;
            StringChartData barCategoryData = new StringChartData(new List<string>() { "1.1", "1.2", "1.3", "1.4", "2.1", "3.1", "4.1", "4.2", "4.3" });
            IEnumerable<double> percentEvidentList = new List<double>() { Math.Round((double)0.9914 * 100, 4) , Math.Round((double)0.7719 * 100, 4), Math.Round((double)1 * 100, 4)   };
            NumericChartData barValues = new NumericChartData(percentEvidentList);
            BarSeries series = new BarSeries();
            series.Categories = barCategoryData;
            series.Values = barValues;
            ThemableColor themableColor = ThemableColor.FromArgb(255, 125, 0, 125);

            series.Fill = new SolidFill(themableColor);
            series.Title = new TextTitle("FY 20");
            barSeriesGroup.Series.Add(series);
            chart.SeriesGroups.Add(barSeriesGroup);
            ValueAxis valueAxis = new ValueAxis();
            valueAxis.Min = 0;
            valueAxis.Max = 100;
            valueAxis.NumberFormat = "0%";
            CategoryAxis categoryAxis = new CategoryAxis();
            chart.PrimaryAxes = new AxisGroup(categoryAxis, valueAxis);

            chart.Legend = new Legend();
            chart.Legend.Position = LegendPosition.Left;

            chartShape.Chart = chart;
            valueAxis.NumberFormat = "0%";
            string outputFilePath = "SampleFile.xlsx";
            File.Delete(outputFilePath);
            IWorkbookFormatProvider formatProvider = new Telerik.Windows.Documents.Spreadsheet.FormatProviders.OpenXml.Xlsx.XlsxFormatProvider();

            using (Stream output = new FileStream(outputFilePath, FileMode.Create))
            {
                formatProvider.Export(workbook, output, TimeSpan.FromSeconds(10));
            }
            Process.Start(new ProcessStartInfo() { FileName = outputFilePath, UseShellExecute = true });
0 comments