Unplanned
Last Updated:
29 Feb 2024 20:15
by Walter
Walter
Created on:
29 Feb 2024 20:15
Category:
SpreadProcessing
Type:
Feature Request
SpreadProcessing: Implement display blanks as property for charts
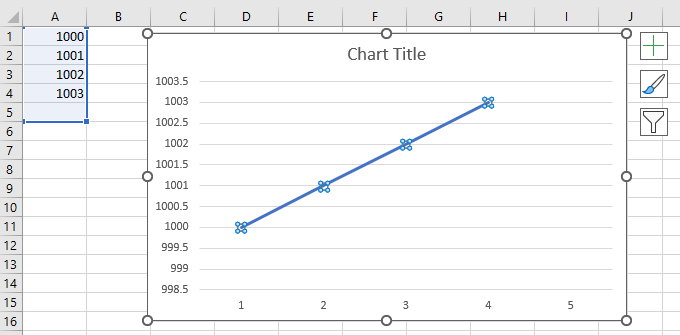
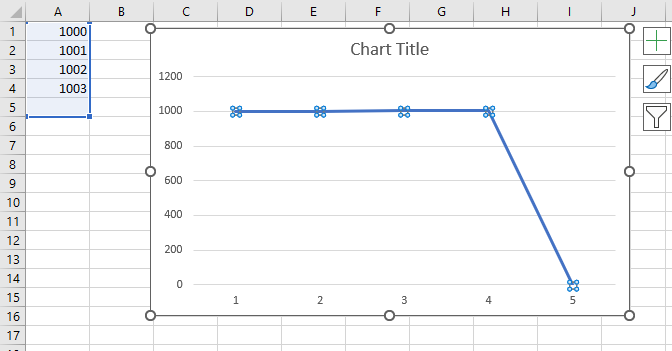
The charts have a display blanks as property which is represented by the dispBlanksAs element. The absence of this element sometimes makes drastic difference in the way a chart might look. E.g. the following chart has a gap in its data and depending on what value dispBlanksAs has, it looks very different.
0 comments


