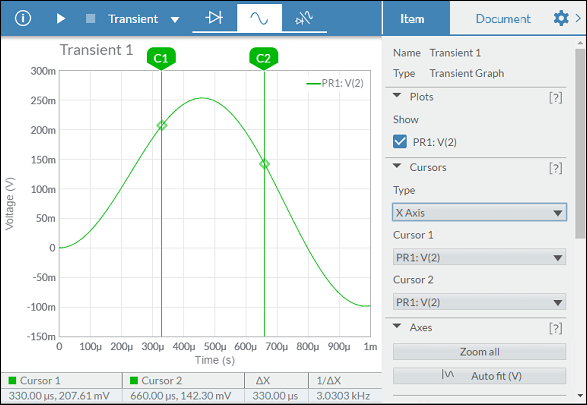
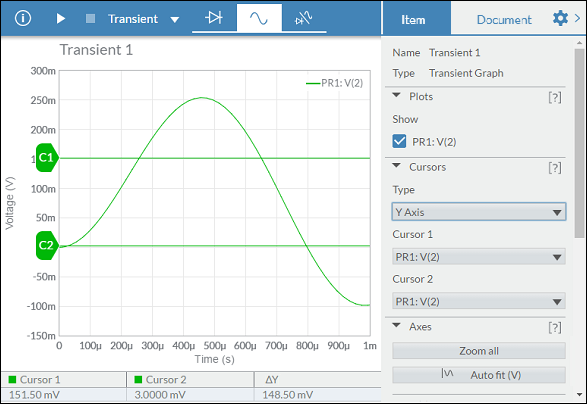
I would like to synchronize several Charts, so when I move the mouse through one of them, the other two Charts show crosshairs at the same position as the first hovered Chart.
===
ADMIN EDIT
===
Prerequisite: Chart Crosshair
This functionality would be very useful for data analysis.
Moving the cursors within the chart itself, allows to define a range within the series, being able to offer useful data.
Examples:
Hello,
I want to connector to be directly connected with the chart.
See https://dojo.telerik.com/AkEHuSiq/3 for reference.
Thank you.
Enhance the Chart date axis label format, so that it's culture-aware in globalization scenarios, and there is no need to set ChartCategoryAxisLabels Format explicitly.
In the meantime, here are a few workarounds for the case when the ChartCategoryAxis BaseUnit is Days and the Chart shows MM/dd labels even to non-US users.
- The easier option is to use a standard format string:
<ChartCategoryAxis BaseUnit="ChartCategoryAxisBaseUnit.Days"
                    Type="ChartCategoryAxisType.Date">
    <ChartCategoryAxisLabels Format="d" />
</ChartCategoryAxis>
- The above contains the year, so another option is MonthDayPattern:
<ChartCategoryAxis BaseUnit="ChartCategoryAxisBaseUnit.Days"
                    Type="ChartCategoryAxisType.Date">
    <ChartCategoryAxisLabels Format="@( CultureInfo.CurrentUICulture.DateTimeFormat.MonthDayPattern )" />
</ChartCategoryAxis>
- To display a shorter numeric month, use the MonthDayPattern to detect the day-month order and then set a custom format string.
Razor
<ChartCategoryAxis BaseUnit="ChartCategoryAxisBaseUnit.Days"
                    Type="ChartCategoryAxisType.Date">
    <ChartCategoryAxisLabels Format="@( GetShortDayMonthPattern() )" />
</ChartCategoryAxis>
C#
    private string GetShortDayMonthPattern()
    {
        var mdp = CultureInfo.CurrentUICulture.DateTimeFormat.MonthDayPattern;
        var separator = CultureInfo.CurrentUICulture.DateTimeFormat.DateSeparator;
        string pattern = mdp.IndexOf("M") < mdp.IndexOf("d") ? $"MM{separator}dd" : $"dd{separator}MM";

        return pattern;
    }
Regards, Author nickname Progress Telerik
In Kendo-React chart i can set the property "maxDivision" like this:
<ChartCategoryAxis>
<ChartCategoryAxisItem
maxDivisions={30}
name="categoryAxisName"
categories={categories}
...
and the chart will show only 30 dates in the displayed range, even if zoom in.
Is there a way for doing the same thing in Blazor Chart?
I tryed Type"fit" and MaxDateGroup but i need to show always all the points and this isnot a good solution.
I tryed ChartCategoryAxisLabels Step="number_of_labels_to_render" but when i zoom in the chart
will not show other dates.
Regards,
Davide
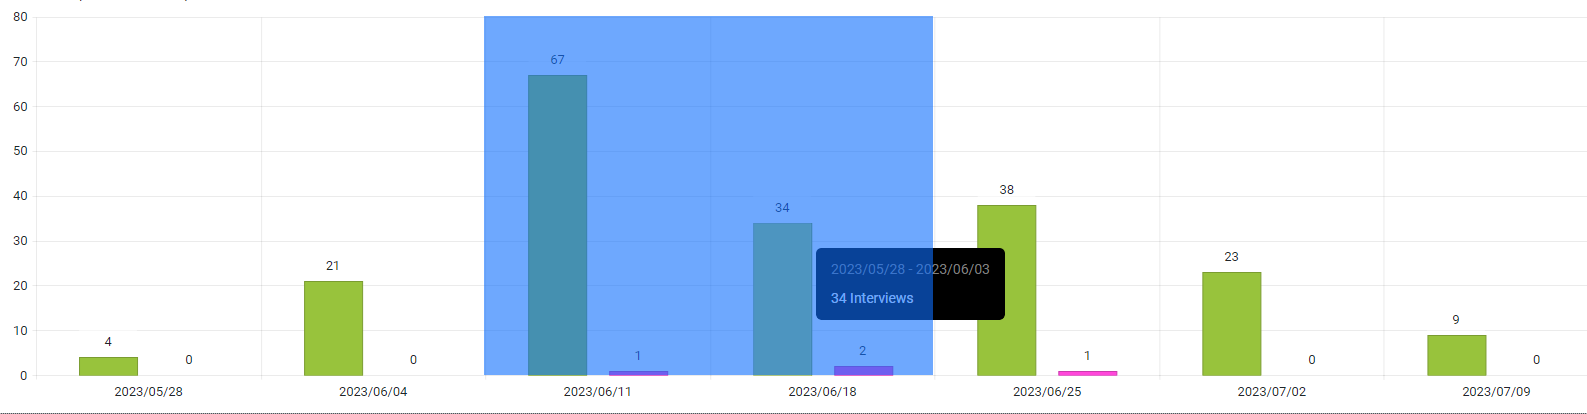
i.e here I would like it to return: 2023/06/11 & 2023/06/18
I want to be able to set different colors for the separate series items.
===
ADMIN EDIT
===
A possible option for the time being is to add each item in a dedicated series where you can specify its color.Please see the links below to see examples of the scale break feature I'm looking for: Scale Breaks - ChartView - Telerik UI for WinForms.
https://docs.telerik.com/devtools/aspnet-ajax/controls/chart/features/scale-breaks
I know about Logarithmic Axis as well, but it's not exactly what I'm looking for.
Hello,
Please allow us to distinguish which mouse button triggered the SeriesClick event.