Hi Team,
Is it possible to remove dll version and report designer path from Creator and Producer metadata tags. We got this requirement from our client. I am posting the remediation steps shared by our client below-
Is this possible to remove Telerik Reporting 14.1.20.618 (http://www.telerik.com/products/reporting.aspx) highlighted part and keep Telerik Reporting only?
                <Telerik.ReportViewer.BlazorNative.ReportViewer
                    @ref="reportViewer"
                    ServiceType="ReportViewerServiceType.REST"
                    PageMode="PageMode.SinglePage"
                    ServiceUrl="@(ServiceUrl)"
                    @bind-ReportSource="@ReportSource"
                    AuthenticationToken="@(AuthToken)"
                    ScaleMode="(ScaleMode)ReportSetItem.Report.ScaleMode"
                    @bind-ParametersAreaVisible="@ParametersAreaVisible"
                    Scale="1.5">
                </Telerik.ReportViewer.BlazorNative.ReportViewer>
The variable, ParametersAreaVisible, is set to false. The report viewer is still showing the parameters area. I went back to the designer and set all parameters to Visible = false. When I did this, the parameters area is not displayed.
The report viewer should respect what is bound to ParametersAreaVisible.
Currently, any custom implementations of the IResourceResolver and ISharedDataSourceResolver require using a parameterless constructor because the types are initialized via Reflection at runtime.
We would like to be able to dependency inject services into the custom resolver implementations through the constructors.
We have an app that loads a list of reports. When a report is selected, a report viewer page is loaded. It contains a set of parameters. In this stage, we get a http 400 error because it is the hitting the GetParameters endpoint right away. The user has not selected any parameters. It should only hit this endpoint when the user has selected the parameters and runs the report.
This is not the behavior in the HTML viewer.
In the images attached, the Initial Load image is the error we get when the report viewer page is loaded.
The Report Source is the payload when the GetParameters endpoint is called. As you can see it's empty since the report is not ran yet.
In the Running image, the error is when the user runs the report.
When I set the Graph Legend Position to Absolute, the Legend is drawn always inside the Plot area:
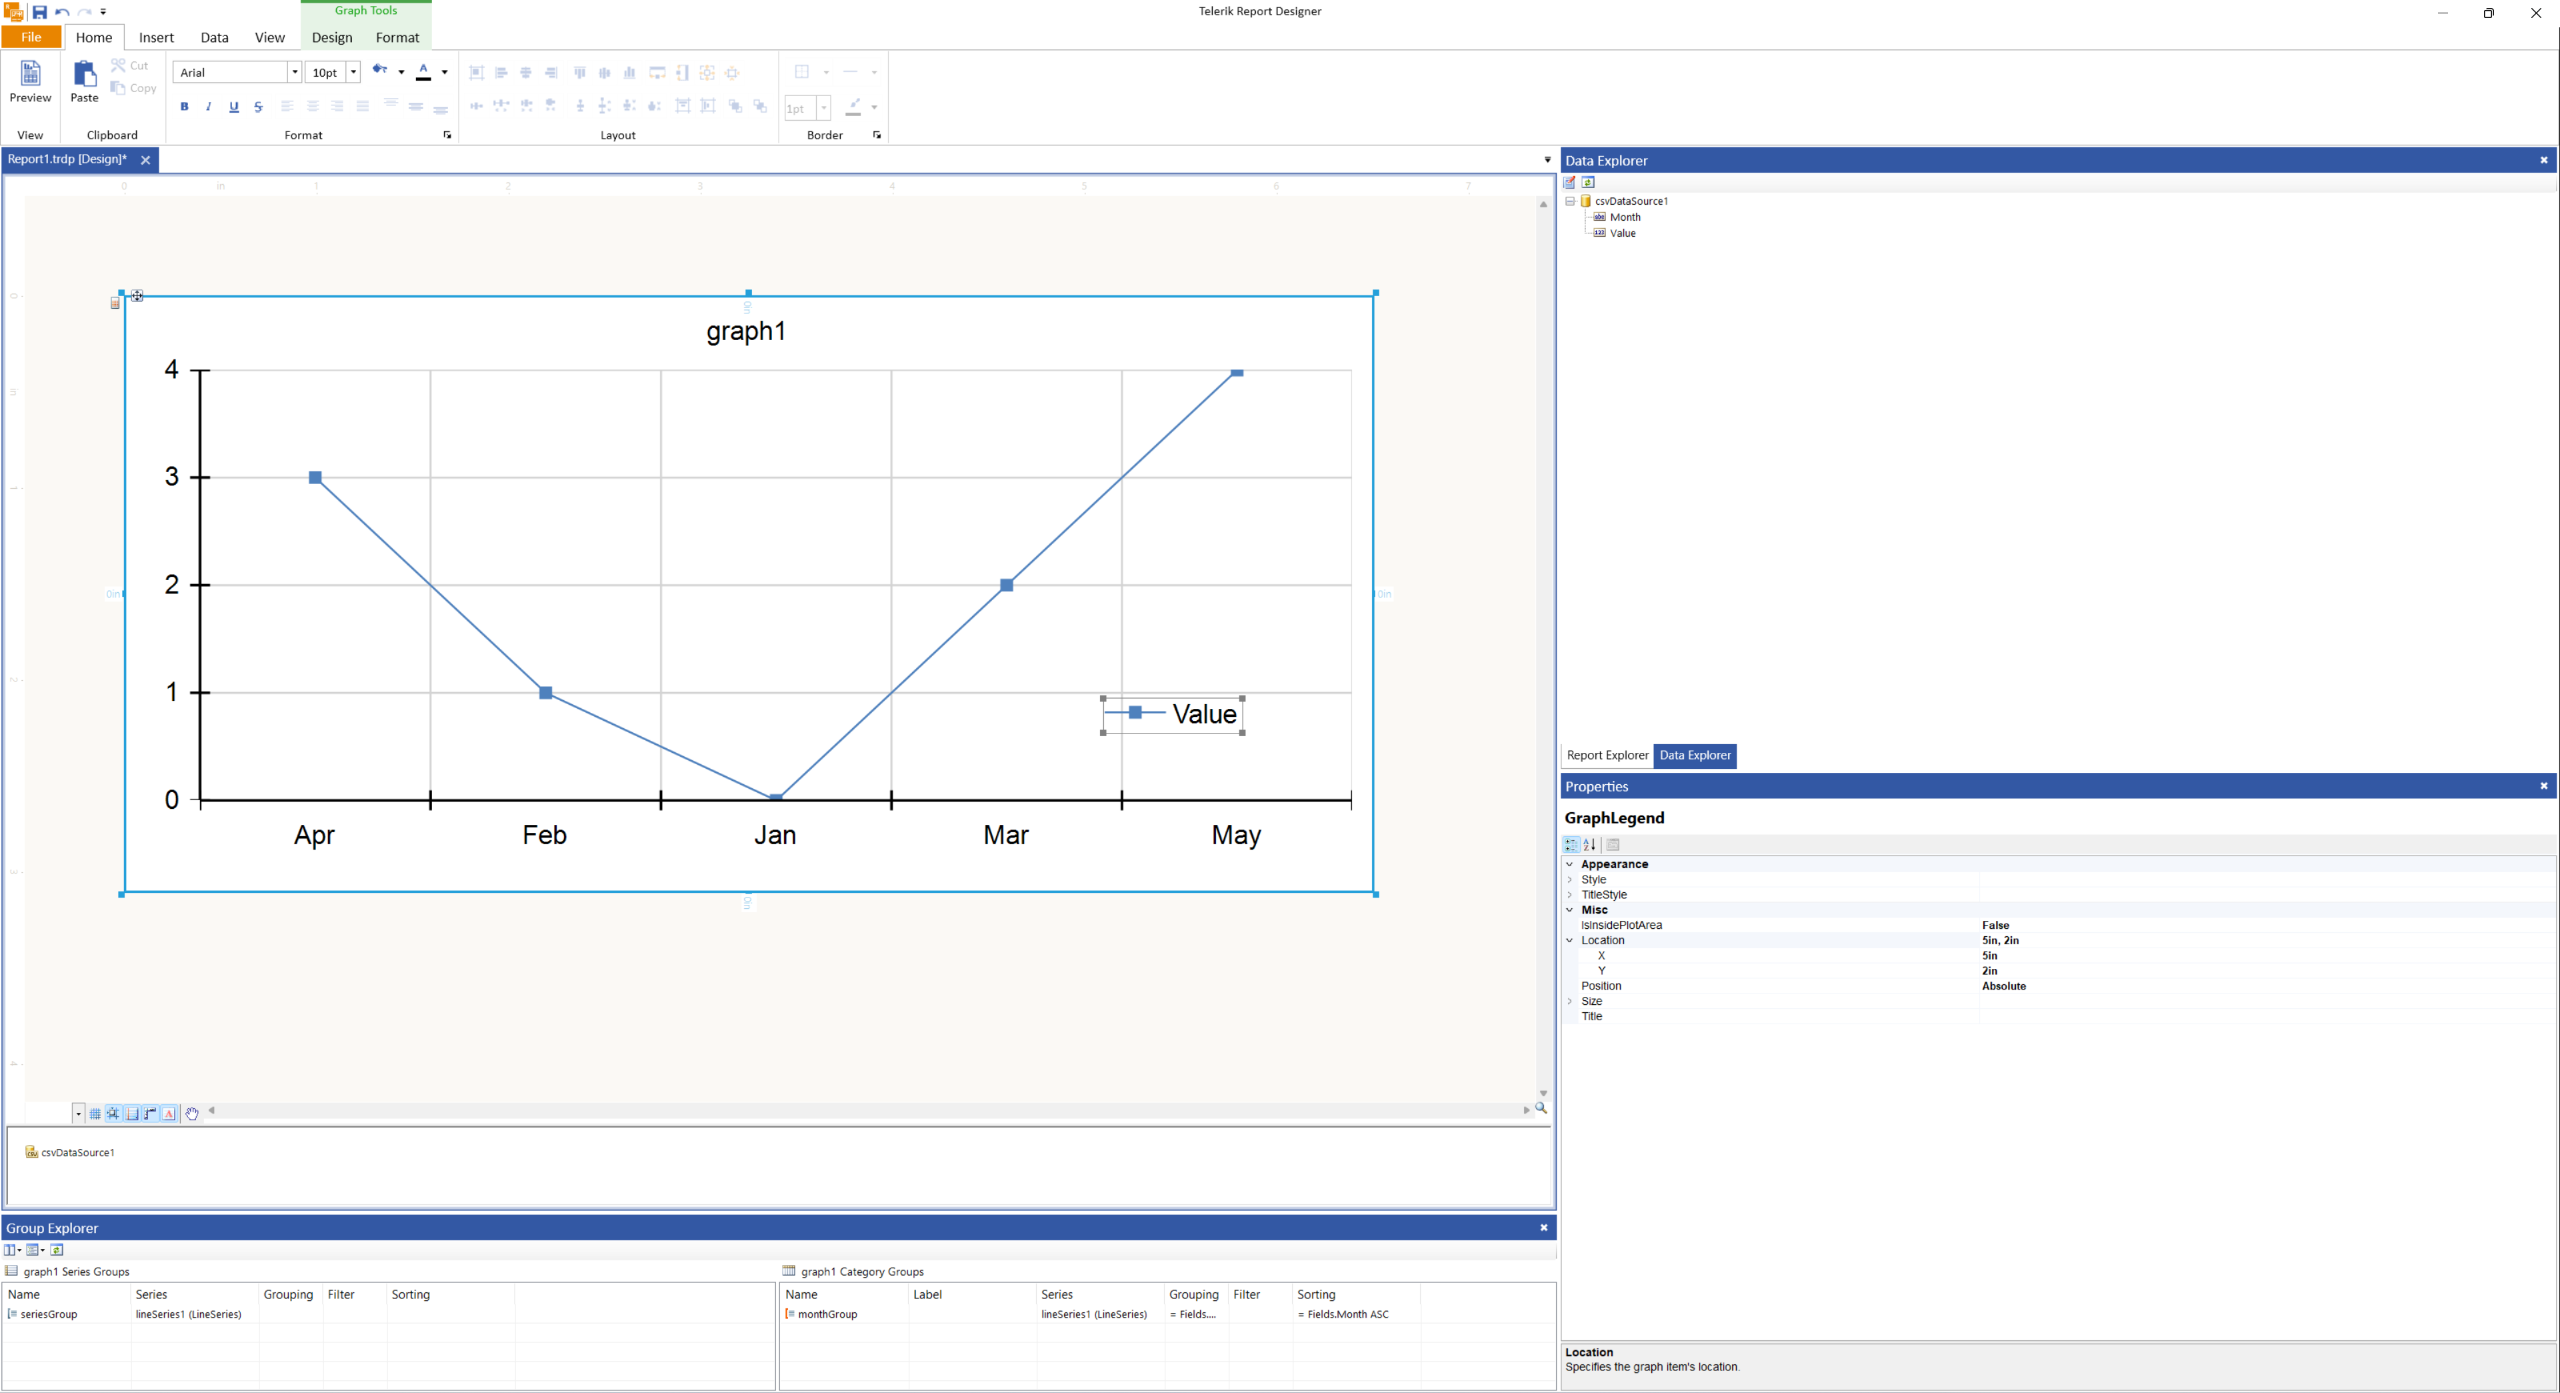
I would expect it to behave as the other Legend Positions and draw the Legend outside the Plot area.
I set globally the culture on the Linux Ubuntu Docker Container. Interestingly, the negative currency with en-US and fr-CA was displayed with the '-' sign rather than in brackets.
This was reproduced even in the values set with the Text Function FormatWithCulture(cultureName, format, args). The function displayed wrong formatting also on Windows, even in the Standalone Report Designer for .NET 8.
When the global culture on Windows was en-US, the negative decimal value formatted without the FormatWithCulture function was displayed correctly in .NET 8.
In the .NET Framework, the negative currencies were displayed as expected in all scenarios.
I have linked also a muted video showing the issue.
When I try to open the edit dialog for a report parameter from the Report Explorer in the .NET Standalone Report Designer, the dialog does not open.
The same appoach works as expected with the .NET Framework Standalone Report Designer.
As an alternative for the .NET Standalone Report Designer, the second approach from the ReportParameter Collection Editor at a Glance - Telerik Reporting article may be used.
In my report, I show a tiny goat symbol with the font 'Segoe UI Emoji'. It looks good in the Standalone Designer for .NET Framework, but it is not shown in the PDF export from my .NET application, although the font is correctly embedded.
In the Standalone Report Designer for .NET 8, the goat is not displayed when previewing or exporting either.
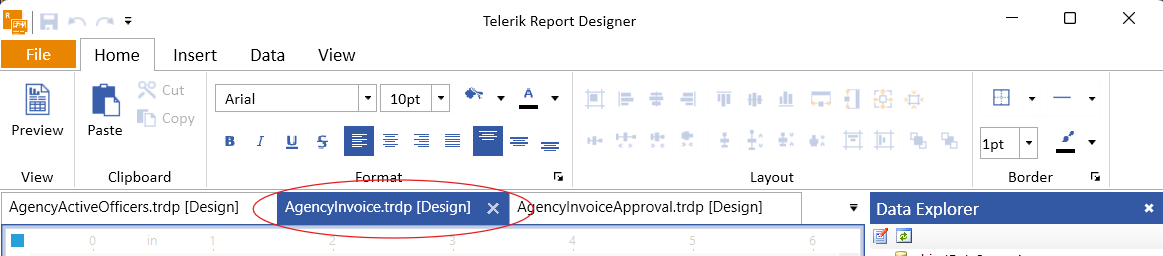
Just a simple quality-of-life improvement, middle-click on the tab should close the report - doing exactly the same thing as clicking the "X" button in the tab. Seems the majority of tabbed UIs follow this convention.
I am working on a report in the .NET Report Designer that takes time parameters. I am looking for a way to replace the DatePicker that is used in the Report Designer parameters section with the DateTimePicker, but I've been told by support that there is no way to do that.
At a minimum, I need a way to specify which picker (Date, Time or DateTime) that the Designer should use. Being able to specify a format would be helpful also. Ideally the stand alone designer would provide a way to customize and view a custom template that is developed for the HTML5 Report Viewer.
I'm stilling trying to figure out what I have to do, but it appears every time a modify the report I'm not going to be able to view it in the Designer and instead I'm going to have to view it in the Report Viewer in the main application, which will be a much slower and more cumbersome process.
The following exception is thrown when rendering a report with enabled Accessibility to PDF with Skia if the report has a Table containing an HtmlTextBox:
Telerik.ReportDesigner.Net Error: 0 : System.NullReferenceException: Object reference not set to an instance of an object.
   at Telerik.Reporting.Pdf.PdfAccessibilityElementWriter.TryAttachToParentNode(ProcessingInstanceIdentifier id, PdfOrderedReference element, Int32 rowIndex, Int32 columnIndex)
   at Telerik.Reporting.Pdf.PdfAccessibilityElementWriter.TryAttachToParentNode(IProcessingElement processingElement, IProcessingElement parentProcessingElement, PdfOrderedReference taggedElementReference)
   at Telerik.Reporting.Pdf.PdfAccessibilityElementWriter.AttachNonLeafNode(LayoutElement element, PdfOrderedReference taggedElementReference)
   at Telerik.Reporting.Pdf.PdfAccessibilityElementWriter.AttachNodeToTree(AccessibilityPdfElement pdfElementType, PdfOrderedReference taggedObjectReference)
   at Telerik.Reporting.Pdf.PdfAccessibilityElementWriter.InitTaggedElement(AccessibilityPdfElement pdfElementType)
   at Telerik.Reporting.Pdf.PdfAccessibilityElementWriter.AddParagraphElement(ITableCell element)
   at Telerik.Reporting.Pdf.PdfAccessibilityElementWriter.Visit(HtmlTextBox htmlTextBox)
   at Telerik.Reporting.Processing.HtmlTextBox.Accept(ProcessingElementVisitor visitor)
   at Telerik.Reporting.Processing.ProcessingElementVisitor.Visit(LayoutElement element)
   at Telerik.Reporting.Writing.AccessibilityElementWriter.StartWrite(ReportItemBase element, Int32& index)
   at Telerik.Reporting.Pdf.PdfAccessibilityElementWriter.StartWrite(ReportItemBase element, Int32& index)
   at Telerik.Reporting.Writing.VisualElementWriter`1.StartWriteAccessibilityItem(ReportItemBase item, ElementPageInfo pageInfo, DocumentWriter writer)
   at Telerik.Reporting.Writing.VisualElementWriter`1.WriteClientFocusableItems(T element, ElementPageInfo pageInfo, DocumentWriter writer)
   at Telerik.Reporting.Writing.VisualElementWriter`1.StartWrite(T element, ElementPageInfo pageInfo, DocumentWriter writer)
   at Telerik.Reporting.Writing.ReportItemBaseWriter`1.StartWrite(T element, ElementPageInfo pageInfo, DocumentWriter writer)
   at Telerik.Reporting.Writing.ElementWriter`1.Telerik.Reporting.Writing.IElementWriter.StartWrite(LayoutElement element, ElementPageInfo pageInfo, DocumentWriter writer)
   at Telerik.Reporting.Writing.WriteStartOperationsDispatcher.Write(IElementWriter writer, LayoutElement element, ElementPageInfo pageInfo, DocumentWriter documentWriter)
   at Telerik.Reporting.Writing.WriteOperationsDispatcher.Write(IElementWriter writer, LayoutElement element)
   at Telerik.Reporting.Writing.WriteOperationsDispatcher.Visit(HtmlTextBox htmlTextBox)
   at Telerik.Reporting.Processing.HtmlTextBox.Accept(ProcessingElementVisitor visitor)
   at Telerik.Reporting.Processing.ProcessingElementVisitor.Visit(LayoutElement element)
   at Telerik.Reporting.Writing.WriteOperationsDispatcher.DispatchWriteOperation(LayoutElement element, ElementPageInfo pageInfo)
   at Telerik.Reporting.Writing.DocumentWriter.Telerik.Reporting.BaseRendering.IWriter.WriteStartElement(LayoutElement element, ElementPageInfo pageInfo)
   at Telerik.Reporting.BaseRendering.PageHandler.Telerik.Reporting.Paging.IPageHandler.StartElement(LayoutElement element, ElementPageInfo info)
   at Telerik.Reporting.Paging.PageStartElement.OutputToPage(IPageHandler handler)
   at Telerik.Reporting.Paging.PageElementsLayer.OutputToPage(IPageHandler handler)
   at Telerik.Reporting.Paging.PageContent.Output(IPageHandler handler)
   at Telerik.Reporting.Paging.PageCompositionBase.OutputPageContent(Stopwatch stopwatchOutputContent, PageContent pageContent)
   at Telerik.Reporting.Paging.PageCompositionBase.<>c__DisplayClass124_0.<CreatePageContentOutputTask>b__0()
Telerik.ReportDesigner.Net Error: 0 : An error has occurred while rendering the report: System.OperationCanceledException: The operation was canceled.
   at System.Threading.CancellationToken.ThrowOperationCanceledException()
   at System.Threading.ManualResetEventSlim.Wait(Int32 millisecondsTimeout, CancellationToken cancellationToken)
   at System.Threading.Tasks.Task.SpinThenBlockingWait(Int32 millisecondsTimeout, CancellationToken cancellationToken)
   at System.Threading.Tasks.Task.InternalWaitCore(Int32 millisecondsTimeout, CancellationToken cancellationToken)
   at System.Threading.Tasks.Task.Wait(Int32 millisecondsTimeout, CancellationToken cancellationToken)
   at System.Threading.Tasks.Task.Wait(CancellationToken cancellationToken)
   at Telerik.Reporting.Paging.PageCompositionBase.SeparateThreadOutputBehavior.Finish()
   at Telerik.Reporting.Paging.PageCompositionBase.CreatePages()
   at Telerik.Reporting.Paging.PagerBase.Telerik.Reporting.Paging.IPager.CreatePages(IPageHandler handler, LayoutElement root)
   at Telerik.Reporting.BaseRendering.RenderingExtensionBase.Render(LayoutElement root, Hashtable renderingContext, Hashtable deviceInfo, CreateStream createStreamCallback, EvaluateHeaderFooterExpressions evalHeaderFooterCallback, PageSettings pageSettings)
A similar error is thrown when rendering with GDI+.
We work in a project with more than 100 parameters. The parameters are sorted in the order we added them.
It is hard to look for a parameter when we need to do a change. A right click "sort" would be great.
I understand that the ReportViewer has a very different paradigm from, say, the RadGridView. However, I believe they should and could be much more similar. With some fairly minor tweaks ReportViewer could be made to be a proper member of the C#/XAML/MVVM environment. Particularly what is needed is a binding to the data source, just like RadGridView's "ItemsSource".
I've begun a discussion in the forum about this topic at https://www.telerik.com/forums/reporting-and-mvvm. With Momchil's help I was able to create a workable solution for my scenario, but it required code that, in my opinion, I shouldn't have to write.
I'd be more that willing to chat about this further and provide more thoughts and details, but since we've made it all the way to 2024 without this being raised, I tend to assume the needs I've expressed may not be as universal as I'd assumed they would be.
Thanks!
Hi,
For our product we were looking into adding additional Request headers to the HTTP requests made by the Telerik Reporting library to the webservice data endpoints for our reports.
We tried adding the headers through a custom DelegatingHandler or HttpClientHandler, but found those were not being picked up.
Not when using the Web Report Designer or Blazor Report Viewer.
Any change we could register such a DelegatingHandler or HttpClientHandler?
Or any other suggestion on a how to add additional headers to the outgoing requests?
Hi Team,
When using the WPF ReportViewer, Reporting appears to only fetch settings from appsetting.json, and ignores any other values coming from things like secrets.json, or any other configuration builder.
Please see the following forum thread, where Lance replied with a test that verifies none of the values from secrets.json were accessible to Reporting even though they are in the global Configuration (at 13 Sep 2024, 12:34 PM (ET) => https://www.telerik.com/forums/simple-wpf-reportviewer-example). Reporting only respected appsettings.json.
Proposed Solution
Telerik Reporting should accept whatever implementation of IConfiguration I choose. Ideally, when setting up my application, there should be one line that looks something like this:settings.AddTelerikReporting(configuration);
That allows me to pass the full view of the Configuration to Reporting that allows it to see more than what might only might be in appsettings.json (secrets, imported configurations, etc).
Thank you,
Brad
Setting the Style > BackgroundImage property of the Linear Gauge > Indicator throws the following error:

This doesn't let me customize the Indicator of the Gauge.
When rendering a report to PDF with the accessibility feature enabled - PDF Device Information Settings at a glance - Telerik Reporting, if there is a table/list/crosstab item that contains an item with a Navigate To Bookmark action pointing to the same BookmarkId, the document won't be rendered because of the following error:
System.ArgumentException: An item with the same key has already been added. Key: (table1) Table X=3810 Y=762 Width=2990 Height=1830
   at System.Collections.Generic.Dictionary`2.TryInsert(TKey key, TValue value, InsertionBehavior behavior)
   at System.Collections.Generic.Dictionary`2.Add(TKey key, TValue value)
   at Telerik.Reporting.Pdf.PdfAccessibilityElementWriter.Visit(Table table)
   at Telerik.Reporting.Processing.Table.Accept(ProcessingElementVisitor visitor)
   at Telerik.Reporting.Processing.ProcessingElementVisitor.Visit(LayoutElement element)
   at Telerik.Reporting.Writing.AccessibilityElementWriter.StartWrite(ReportItemBase element, Int32& index)
   at Telerik.Reporting.Pdf.PdfAccessibilityElementWriter.StartWrite(ReportItemBase element, Int32& index)
   at Telerik.Reporting.Writing.VisualElementWriter`1.StartWriteAccessibilityItem(ReportItemBase item, ElementPageInfo pageInfo, DocumentWriter writer)
   at Telerik.Reporting.Writing.VisualElementWriter`1.WriteClientFocusableItems(T element, ElementPageInfo pageInfo, DocumentWriter writer)
   at Telerik.Reporting.Writing.VisualElementWriter`1.StartWrite(T element, ElementPageInfo pageInfo, DocumentWriter writer)
   at Telerik.Reporting.Writing.ReportItemBaseWriter`1.StartWrite(T element, ElementPageInfo pageInfo, DocumentWriter writer)
   at Telerik.Reporting.Writing.ElementWriter`1.Telerik.Reporting.Writing.IElementWriter.StartWrite(LayoutElement element, ElementPageInfo pageInfo, DocumentWriter writer)
   at Telerik.Reporting.Writing.WriteStartOperationsDispatcher.Write(IElementWriter writer, LayoutElement element, ElementPageInfo pageInfo, DocumentWriter documentWriter)
   at Telerik.Reporting.Writing.WriteOperationsDispatcher.Write(IElementWriter writer, LayoutElement element)
   at Telerik.Reporting.Writing.WriteOperationsDispatcher.Visit(Table table)
   at Telerik.Reporting.Processing.Table.Accept(ProcessingElementVisitor visitor)
   at Telerik.Reporting.Processing.ProcessingElementVisitor.Visit(LayoutElement element)
   at Telerik.Reporting.Writing.WriteOperationsDispatcher.DispatchWriteOperation(LayoutElement element, ElementPageInfo pageInfo)
   at Telerik.Reporting.Writing.DocumentWriter.Telerik.Reporting.BaseRendering.IWriter.WriteStartElement(LayoutElement element, ElementPageInfo pageInfo)
   at Telerik.Reporting.BaseRendering.PageHandler.Telerik.Reporting.Paging.IPageHandler.StartElement(LayoutElement element, ElementPageInfo info)
   at Telerik.Reporting.Paging.PageStartElement.OutputToPage(IPageHandler handler)
   at Telerik.Reporting.Paging.PageElementsLayer.OutputToPage(IPageHandler handler)
   at Telerik.Reporting.Paging.PageContent.Output(IPageHandler handler)
   at Telerik.Reporting.Paging.PageCompositionBase.OutputPageContent(Stopwatch stopwatchOutputContent, PageContent pageContent)
   at Telerik.Reporting.Paging.PageCompositionBase.<>c__DisplayClass124_0.<CreatePageContentOutputTask>b__0()
In the Standalone Report Designer, collection editors, such as the ReportParameter Collection Editor, do not show the context menu when a property is right-clicked, and resetting property values through such windows is not possible.
The Properties window of the designer illustrates the expected behavior.
