The following warning is shown in the browser console when starting my Blazor application when I use the native Blazor Report Viewer:
WARNING: Processing source-maps of https://localhost:7025/_content/Telerik.ReportViewer.BlazorNative/js/reporting-blazor-viewer.js took longer than 11000 ms so we continued execution without waiting for all the breakpoints for the script to be set.Could not read source map for https://localhost:7025/_content/Telerik.ReportViewer.BlazorNative/js/reporting-blazor-viewer.js: Unexpected 404 response from https://localhost:7025/_content/Telerik.ReportViewer.BlazorNative/js/reporting-blazor-viewer.js.map:
In PDF rendering, my SVG image does not get clipped according to the design-time look of the report while in Excel(XLSX), the same SVG content appears almost correctly.
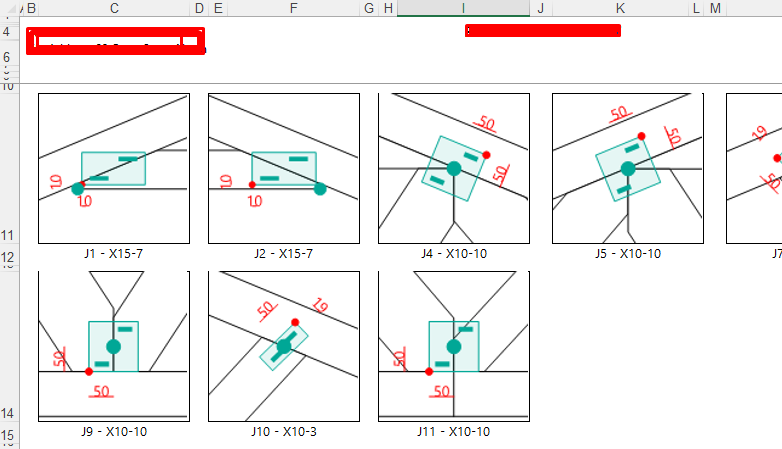
In the PDF rendering engine, clipping SVGs is not supported out-of-the-box. Instead, the whole SVG content is rendered without applying any clipping which can lead to differences between previewing the report in the report designer and when exported to PDF. For example:
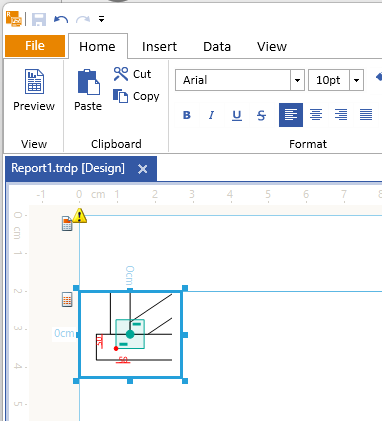
In design
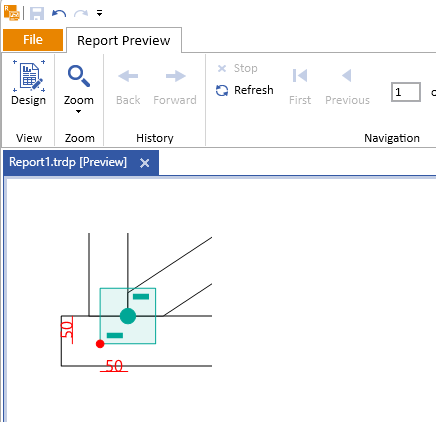
In the report preview.
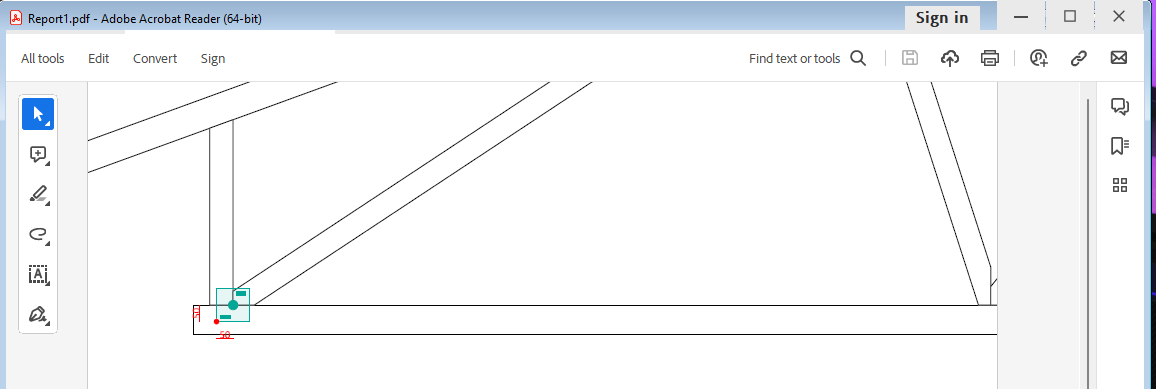
In the PDF file.
When I have a report that uses the Shape Report Item and I export it to Excel(XLSX) in Linux, upon opening the Excel file, I am met with the following warning:
We found a problem with some content in "Report.xlsx". Do you want us to try to recover as much as we can? If you trust the source of this workbook, click Yes
The DocumentMapVisible/ParametersAreaVisible settings that I set in the initialization of the native Blazor Report Viewer are not respected.
I can hide/show these areas from the buttons in the report viewer's toolbar but am unable to have them hidden initially.
Currently, the only workaround is to have a JS function that clicks on the toolbar after initialization:
function reportViewerMapClick() {
    $(".k-i-dictionary-add").click();
}
I just migrated from building with react-scripts to Vite, as it seems react-scripts is deprecated. After the change, the react report viewer is not functioning correctly. Browser console shows:
Instantiation of Kendo TreeView as Document Map threw an exception TypeError: $kendoHtmlEncode is not a function

Uncaught (in promise) TypeError: $kendoHtmlEncode is not a function
The DocumentMapVisible settings that I set in the initialization of the WPF Report Viewer are not respected.
I can hide/show these areas from the buttons in the report viewer's toolbar but am unable to have them hidden initially.
Currently, the only workaround is to set an event on this.ReportViewer1.RenderingEnd += ReportViewer1_RenderingEnd;
private void ReportViewer1_RenderingEnd(object sender, Telerik.ReportViewer.Common.RenderingEndEventArgs args)
		{
			this.ReportViewer1.DocumentMapVisible = false;
		}
I installed the @progress/telerik-angular-report-viewer - npm (npmjs.com) package of version 19.23.718 in my project and noticed that the viewer's SASS template uses incorrect versions for its resource references.
    <link href="{service}resources/font/fonticons-17.1.23.719.css/" rel="stylesheet" />
    <link href="{service}resources/styles/telerikReportViewer-17.1.23.719.css/" rel="stylesheet" />
For the template to work with a Reporting service of the latest version(17.1.23.718), the template must be edited.
Hi,
I use Azure App Service Linux to host my .NET CORE ASP Server with Blazor as Frontend.
There is a way to embed Fonts using the telerikReporting / privateFonts configuration part. But as an application intended for multiple users (using different copies of Azure App Services), this is not a proper solution.
My idea whould be, to allow my client, who designs their own template using Telerik Report Designer (Standalone) (baed on many premade templates from my programm), to allow to embed their own Fonts from there, and upload the TRDX file to my server and let it render. Note that I use Telerik Reporting only in Backend and returns only rendered PDF files to the client (font end)
In short, allow TTF / OTF Font embedding in Telerik Report Designer, store it INTO TRDX / TRDP files.
Thanks
Vulpes
Add a property to be able to suppress duplicate values in a column, which could be optionally shown after a page break.
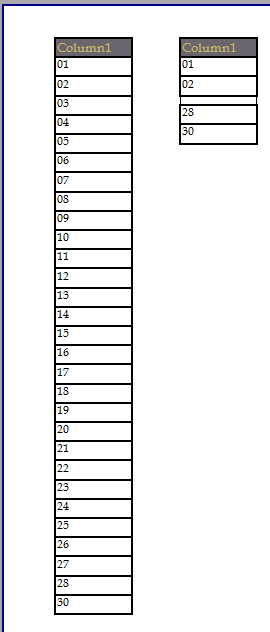
When I conditionally hide a TextBox in a table, I got unwanted spaces between the hidden boxes.
In my example below I have 30 records as seen in the first table.
In the second table I have the same data, but conditionally formatting it to hide based on the following:
= Fields.Column1 > 2 and Fields.Column1 < 28
Notice the space that shows between 02 and 28.
The background image of a report item is not sized correctly when exporting in PowerPoint format (PPTX) and have the UseMetafile flag set to false.
If the flag UseMetafile is set to true, the image is rendered as expected.
We have an application that is generating very large reports in "Print Preview" mode.
When the first page of the report is generated the Export button gets enabled. If the user does not wait for the report to be fully generated, and clicks the Export button, it doesn't do anything. We have also seen the application crash after clicking the Export button while the pages are loading.
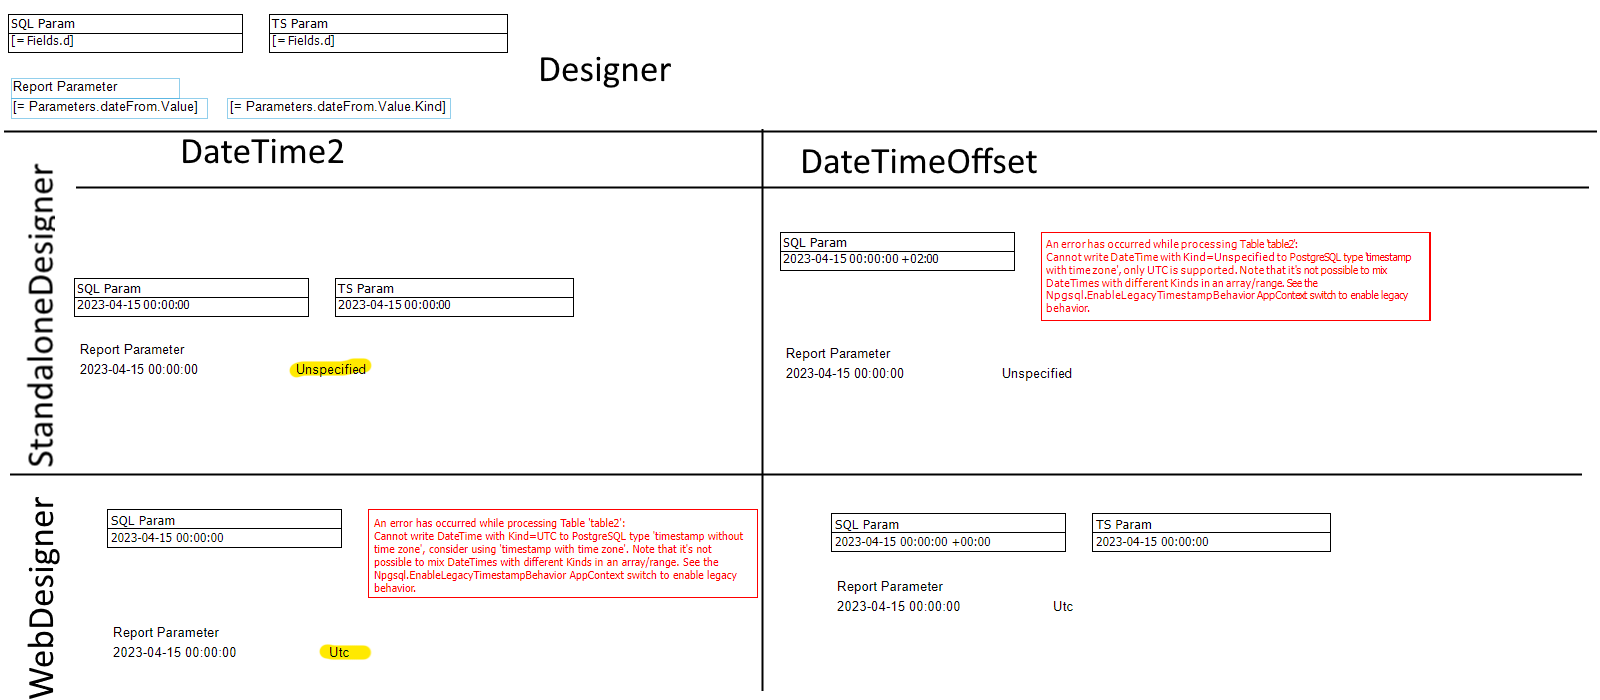
Currently the behavior of the Web Designer and Standalone Designer is different in regard to DateTime Report Parameters and its "Kind" property.
The Web Designer will assume the value is of Kind "Utc" and the Standalone Designer uses "Unspecified".
This recently became more of an issue since the newer PostgreSQL Provider versions are a lot more strict regarding the "Kind" property:
Npgsql: Timestamp rationalization and improvements
The consequence of this is not being able to use Sql parameters which will work in both the WebDesigner/WebViewer and the StandaloneDesigner:
To resolve this issue right now, one would need to resort to ugly workarounds:
- Add a custom function which receives a DateTime "d" and DateTimeKind "k" value and returns the DateTime value "d" with the Kind set to "k"
- Having to include a user dll to add that function seems overkill
- You will need to change every report currently in use
- Change the behavior of the WebDesigner to match the behavior of the Standalone Designer by using a custom IReportSourceResolver, manipulating currentParameterValues
- The Kind Property is set to "Unspecified" which is arguably the worst option to take between the three
To properly address this issue it needs to be possible to set the Kind property in the Viewer. Or at least the behavior between the WebDesigner and Standalone Designer should be the same.
Additionally/Alternativly it should be possible to set the target Kind in the Report Parameter.
With kind regards,
Dominik Rothert
The R2 2023 Standalone Report Designer for .NET cannot be run with the .NET 7 runtime that previously worked(approach - https://docs.telerik.com/reporting/knowledge-base/how-to-load-dot-net-7-assemblies-in-srd-dot-net).
Error: 'Could not load file or assembly 'System.Configuration.ConfigurationManager, Version=7.0.0.0, Culture=neutral, PublicKeyToken=cc7b13ffcd2ddd51'. The system cannot find the file specified.'
When designing reports with lots of parameters (which is very common for my usage), I often get error message "Missing or invalid parameter value" or "Syntax error in expression". I find it very time consuming and annoying to manually check "all" parameters in order to identify which one is causing the issue.

Would it be possible to include more details in these error messages, e.g. by including the name of the (first) incorrect parameter? Preferably for the message in report viewer / preview, but at least in the log file.
https://www.telerik.com/forums/missing-or-invalid-parameter-value-please-input-valid-data-for-all-parameters