For the new Swiss paiment system, we need to add a QR Code with a logo inside it. The logo must be centered and be 7x7 mm.
Currently, there is no possibility to do it with Telerik Reporting, so please add it.
We have implemented custom storage (IDefinitionStorage) with the SaveDefinition method where it saves the edited report in a custom way. There can be some validations and save can fail. For this, I am just throwing a new Exception. The error message is showing in a general way, and it doesn't show my custom message.
Hi,
I'm not reporting an issue here, just making a suggestion about a minor change that I would consider as an improvement.
I'm loading at runtime a report template that was created using the standalone report designer. I'm dynamically replacing all the 'DataSources' of the report, and thus I have to go through all the items of the report to find them all.
The first step is to flatten all the items with a recursive call, starting from the 'Report'. I get a list of ReportItem, and I can cycle through this list and find those that inherits from 'DataItem'. From there, I just have to pick all the distinct DataSources from these DataItems.
And it almost works, except that I'm missing the DataSource from the Report itself, as the Report class does not inherit from DataItem but implements IDataItem.
If IDataItem was public, I could simply use it instead of 'DataItem', but as it is internal I have to handle a special case. And I don't like that.
Maybe I'm missing a good reason to keep this interface internal, but if not my suggestion is to make it public.
Regards,
Olivier
The FreezeColumnHeaders functionality doesn't behave properly when Action is set on the header. The white background color of the headers which we need to see in the viewer when the FreezeColumnHeaders property is set to True is missing. Please, check the attached project which reproduces the issue. If you reset the Action property of the ID header, then the FreezeColumnHeaders functionality works as expected.
When a Report with ObjectDataSourceParameter is loaded into the WebReportDesigner, the designer throws an error when trying to initialize the parameter.
Could not create instance of 'ObjectDataSourceParameter'. TypeError: Cannot read property 'push' of undefined
    at new d (http://localhost:23456/api/reportdesigner/designerresources/js/webReportDesigner-14.2.20.1021.min.js/:9:89908)
    at new a (http://localhost:23456/api/reportdesigner/designerresources/js/webReportDesigner-14.2.20.1021.min.js/:9:277743)
    at s.CreateInstance (http://localhost:23456/api/reportdesigner/designerresources/js/webReportDesigner-14.2.20.1021.min.js/:9:644848)
    at d.<anonymous> (http://localhost:23456/api/reportdesigner/designerresources/js/webReportDesigner-14.2.20.1021.min.js/:9:515470)
    at Generator.next (<anonymous>)
    at http://localhost:23456/api/reportdesigner/designerresources/js/webReportDesigner-14.2.20.1021.min.js/:9:513964
    at new Promise (<anonymous>)
    at l (http://localhost:23456/api/reportdesigner/designerresources/js/webReportDesigner-14.2.20.1021.min.js/:9:513709)
    at d.CreateComponent (http://localhost:23456/api/reportdesigner/designerresources/js/webReportDesigner-14.2.20.1021.min.js/:9:515160)
    at a.<anonymous> (http://localhost:23456/api/reportdesigner/designerresources/js/webReportDesigner-14.2.20.1021.min.js/:9:58884)
The ObjectDataSource component in the Web Report Designer does not have complete design-time support. The major things that are missing:
- there is no dedicated wizard that helps to discover and select business classes and appropriate data retrieval methods.
- its data schema is not retrieved from the REST service and since it's unavailable, the Edit Expression dialog does not populate its Fields collection.
Example:
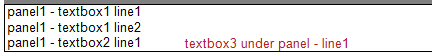
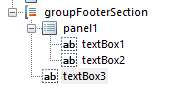
One panel contains two textboxes which both have property Docking set to 'Top'. If the first textbox expands when rendering as a result of overflowing content and property CanGrow set to 'True', the next textbox seems to be correctly positioned, but any item position below the panel with Docking set to 'Top' will be incorrectly positioned.
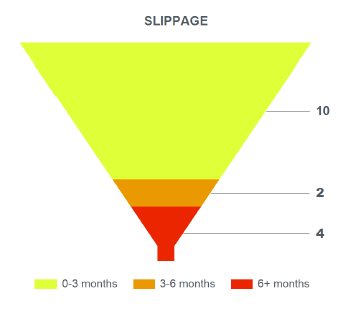
It would be really great if there is a Funnel chart.
We are trying to visualize the quantitative slippage in tasks assignment in a given month-range.
We did it very well in SSRS Reporting and as we migrate to Telerik Reporting, we can't quite figure out how to present it.
The SQL datasource incorrectly recognizes Table Variables in its SQL statement as parameters. The SQL wizard shows the "Configure data source parameter" page and fails to execute the statement.
PROBLEM DESCRIPTION:
A simple statement that uses Table Variables is shown below:
USE AdventureWorks
DECLARE @TestUDTs TABLE(AddressTypeID int NOT NULL, [Name] dbo.Name NOT NULL PRIMARY KEY CLUSTERED(AddressTypeID))
INSERT @TestUDTs(AddressTypeID, [Name]) SELECT AddressTypeID,[Name]
FROM Person.AddressType SELECT * FROM @TestUDTs
The Angular Report Viewer uses the jQuery npm package, while the Web Report Designer uses jQuery.min.js directly from a CDN. If you try to use both Angular Viewer and JS Web Designer in the same application there will be a conflict while loading jQuery twice from the different sources. This is why the Angular Report Viewer cannot be loaded together with the JS Web Report Designer in the same application. The KB article Displaying the Web Report Designer in Angular application provides a Known Issues section at the bottom where this problem is explained:
"Telerik Web Report Designer could not be integrated into Angular application together with Angular Telerik Report Viewer. That is why this article shows how to use the Telerik Web Report Designer in angular application with jQuery-based HTML5 Telerik Report Viewer."