Hello,
I want to connector to be directly connected with the chart.
See https://dojo.telerik.com/AkEHuSiq/3 for reference.
Thank you.
I would like to synchronize several Charts, so when I move the mouse through one of them, the other two Charts show crosshairs at the same position as the first hovered Chart.
===
ADMIN EDIT
===
Prerequisite: Chart Crosshair
I want to be able to dynamically enable/disable the Pan and Zoom functionalities at runtime. Currently, the Chart does not react to such changes.
===
ADMIN EDIT
===
A possible option for the time being is to dispose the component and re-initialize it after changing the Pan/Zoom properties: https://blazorrepl.telerik.com/mSuNQkEj10nSug2k22.
Hi,
We tried making the name property of our TelerikChartSeries dynamic by binding it to a string value. This however seems to completely crash startup, the browser tab freezes and the console doesn't show any errors. If we just put in a simple string in the Name property the application runs without a problem.
<TelerikChartSeries Type="ChartSeriesType.Column" Name="@Team1Name" Data="@Results" Field="@nameof(ChartViewModel.Team1Score)" CategoryField="@nameof(ChartViewModel.CategoryName)">
    <TelerikChartSeriesLabels Visible="true" />
</TelerikChartSeries>
As you can see in this example we're binding the Name property to Team1Name which can be changed whenever another team is selected from a dropdownlist.
Thank you in advance.
The context DataItem is null for subsequent ChartSeries. It receives the correct object for the first ChartSeries, but for the rest is null.
<Admin Edit>
A workaround, for the time being, would be to remove the Template and let the Tooltip display the default value, which will be correct.
</Admin Edit>
Reproduction code:
<TelerikChart>
    <ChartTitle Text="Unrecoverable Errors Per Minute vs. Signal Level" />
    <ChartCategoryAxes>
        <ChartCategoryAxis Type="@ChartCategoryAxisType.Category" />
    </ChartCategoryAxes>
    <ChartValueAxes>
        <ChartValueAxis>
            <ChartValueAxisLabels Visible="true" />
        </ChartValueAxis>
    </ChartValueAxes>

    <ChartTooltip Visible="true">
        <Template>
            @{
                var data = context.DataItem as ModelData;
                <div class="card" style="font-size: 0.8rem; color: black">
                    <span>@($"{data.Value}")</span>
                    <span>@($"{data.Type}")</span>

                </div>
            }
        </Template>
    </ChartTooltip>

    <ChartSeriesItems>
        <ChartSeries Type="ChartSeriesType.Line"
                     Data="@ChartData1"
                     CategoryField="@nameof(ModelData.Type)"
                     Field="@nameof(ModelData.Value)">
        </ChartSeries>
        <ChartSeries Type="ChartSeriesType.Line"
                     Data="@ChartData2"
                     CategoryField="@nameof(ModelData.Type)"
                     Field="@nameof(ModelData.Value)">
        </ChartSeries>
        <ChartSeries Type="ChartSeriesType.Line"
                     Data="@ChartData3"
                     CategoryField="@nameof(ModelData.Type)"
                     Field="@nameof(ModelData.Value)">
        </ChartSeries>
    </ChartSeriesItems>

</TelerikChart>

@code {
    public class ModelData
    {
        public string Type { get; set; }
        public double Value { get; set; }
    }

    public List<ModelData> ChartData1 = new List<ModelData>() { new ModelData() { Type = "S1", Value = 1 } };
    public List<ModelData> ChartData2 = new List<ModelData>() { new ModelData() { Type = "S2", Value = 5 } };
    public List<ModelData> ChartData3 = new List<ModelData>() { new ModelData() { Type = "S3", Value = 9 } };
}
Hello support team,
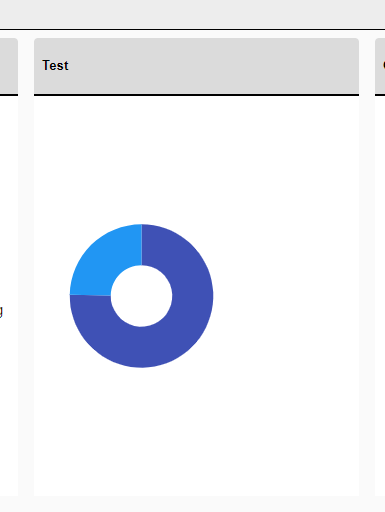
from the donut chart example under https://demos.telerik.com/blazor-ui/chart/donut-chart:
Is there a specific reason why all charts have a Template sub-property for the ChartSeriesTooltip construct but the Template field with the template syntax for the ChartSeriesLabels construct? I would favour a unified syntax for both of the properties, if this is possible somehow...
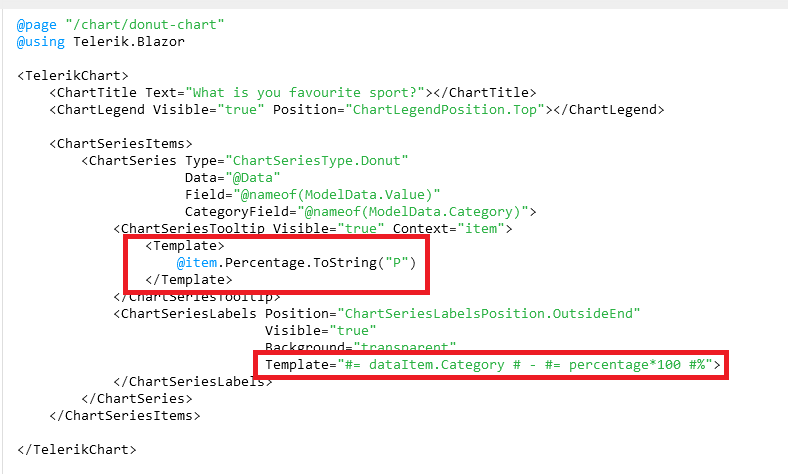
Is this planned for the future to be unified? Especially formatting like shown under https://docs.telerik.com/blazor-ui/knowledge-base/chart-format-percent is not as simple as I would have expected as nobody wants to touch JavaScript code literally :D (Also, localizing data seems quite difficult with that technique).
The best option in my opinion would be to remove those templates completely and just let the user decide what to show there while using a field called e.g. TooltipMappingName and LabelMappingName or something like that. This gives the chart the maximum of configuration possible.
Example:
<TelerikChart>
    <ChartTitle Text="What is you favourite sport?"></ChartTitle>
    <ChartLegend Visible="true" Position="ChartLegendPosition.Top"></ChartLegend>

    <ChartSeriesItems>
        <ChartSeries Type="ChartSeriesType.Donut"
                     Data="@Data"
                     Field="@nameof(ModelData.Value)"
                     CategoryField="@nameof(ModelData.Category)">
            <ChartSeriesTooltip Visible="true" Context="item" TooltipMappingName="@nameof(ModelData.Tooltip)"/>
            <ChartSeriesLabels Position="ChartSeriesLabelsPosition.OutsideEnd"
                               Visible="true"
                               Background="transparent"
                               LabelMappingName="@nameof(ModelData.Label)">
            </ChartSeriesLabels>
        </ChartSeries>
    </ChartSeriesItems>

</TelerikChart>

@code {
    public class ModelData
    {
        public string Category { get; set; }
        public int Value { get; set; }
  public string Tooltip { get; set; }
        public string Label { get; set; }
    }

    public List<ModelData> Data = new List<ModelData>()
    {
        new ModelData()
        {
            Category = "Football",
            Value = 35,
   Tooltip = "35%",
   Label = "Football: 35%"
        },
        new ModelData()
        {
            Category = "Basketball",
            Value = 25,
   Tooltip = "25%",
   Label = "Basketball: 25%"
        },
        new ModelData()
        {
            Category = "Volleyball",
            Value = 20,
   Tooltip = "20%",
   Label = "Volleyball: 20%"
        },
        new ModelData()
        {
            Category = "Rugby",
            Value = 10,
   Tooltip = "10%",
   Label = "Rugby: 10%"
        },
        new ModelData()
        {
            Category = "Tennis",
            Value = 10,
   Tooltip = "10%",
   Label = "Tennis: 10%"
        }
    };
}
Best regards,
Christian
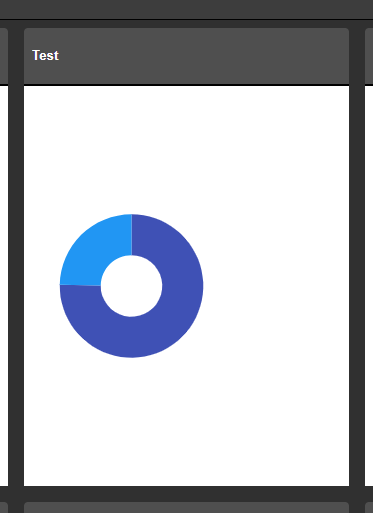
Our Site supports multiple themes that we have built using the SASS Theme Builder. For all Telerik Components we have used so far the theme changes on them as expected when using the example found here (Change Theme at Runtime). The problem seems to be the chart component will not adhere to the newly applied theme after its initial load. Seems like this is because it is shown as an SVG with hardcoded attributes on the element. Is there a workaround for this (other than reloading the components entirely)?
Before & After Theme Change:
I have a line chart I am using to plot two related series of data. When these two series have the same values, or very similar values, the series that is second in the render order completely covers up the first line. This makes it look like the first line isn't being rendered, and makes it impossible to access the tooltips for the first series. I need a way to disambiguate overlapping data.
Thank you
Currently, scatter line plots do not support the stepped line style. This is something that would be hugely beneficial to us in our heavy utilization of scatter line plots with time series data.

Is it possible to use a different marker type other than the one provided by ChartSeriesMarkerType enum?
We would like to use a custom icon for some Scatter data but this doesn't seem to be supported out of the box. Please let us know if this is possible in the current framework, if not - can it be added as a feature?
Thanks,
Sean
I am trying to programmatically update the Chart data during runtime to display live data. The Chart does not seem to refresh and show this change in the viewport.
I've tried:
- using an Observable Collection;
- creating a new collection instance and reassigning the Data parameter;
- calling the Refresh method;
The result is the same - the Chart does not react to the data change. This applies to other component parameters as well.
===
ADMIN EDIT
===
A possible workaround for the time being is forcing the Chart to re-render. To do so, you may wrap the Chart in a custom component and call StateHasChanged() in this component when the data is updated.Here is a runnable sample: https://blazorrepl.telerik.com/wxEzwxbJ24WDjnMp11.
Currently, the Chart does not plot anything when zero values are included in the dataset on a logarithmic axis.
Reproduction: https://blazorrepl.telerik.com/cdYgkWFH23W9PVon54
At least the "Success" data should be plotted.