Unplanned
Last Updated: 20 Jun 2024 09:16 by ADMIN
I would like to customize the appearance of the Chart markers. For example, in a Scatter Chart, I want to set different markers than the ones supported in the ChartSeriesMarkersType enum.
Completed
Last Updated: 06 Oct 2022 09:18 by ADMIN
Created by: Sean
Comments: 1
Category: Charts
Type: Feature Request
1

Is it possible to use a different marker type other than the one provided by ChartSeriesMarkerType enum?


We would like to use a custom icon for some Scatter data but this doesn't seem to be supported out of the box. Please let us know if this is possible in the current framework, if not  - can it be added as a feature?


Thanks,

Sean

Duplicated
Last Updated: 09 Aug 2022 13:33 by ADMIN

See attached image. I want an option to change position on ticks, like in Kendo (see here).

I can't find an option in docs to move the axis position.

Currently, I get the desired result using SyncFusion Chart Component, attribute LabelPlacement allow selection between OnTicks and BetweenTicks option.

Unplanned
Last Updated: 08 Sep 2023 12:45 by Mark
Created by: Nikolas
Comments: 1
Category: Charts
Type: Feature Request
8

Hello,

Please allow us to distinguish which mouse button triggered the SeriesClick event.

Declined
Last Updated: 12 Jul 2022 08:13 by ADMIN
Created by: Brad
Comments: 1
Category: Charts
Type: Feature Request
1

Currently, scatter line plots do not support the stepped line style. This is something that would be hugely beneficial to us in our heavy utilization of scatter line plots with time series data.

Declined
Last Updated: 05 Jul 2022 16:09 by ADMIN
Created by: Brad
Comments: 5
Category: Charts
Type: Feature Request
3

It would be fantastic to be able to visualize boolean data on a time based chart. We have a lot of time series data, and a good bit of it is boolean. It would be very beneficial to be able to plot that data along side our numeric data to provide context to both. 

Example (blue/green bar at bottom of chart):

Warm storage now available in Azure Time Series Insights - Microsoft Tech  Community

Duplicated
Last Updated: 27 Jun 2022 15:15 by ADMIN
Created by: Brad
Comments: 1
Category: Charts
Type: Feature Request
4

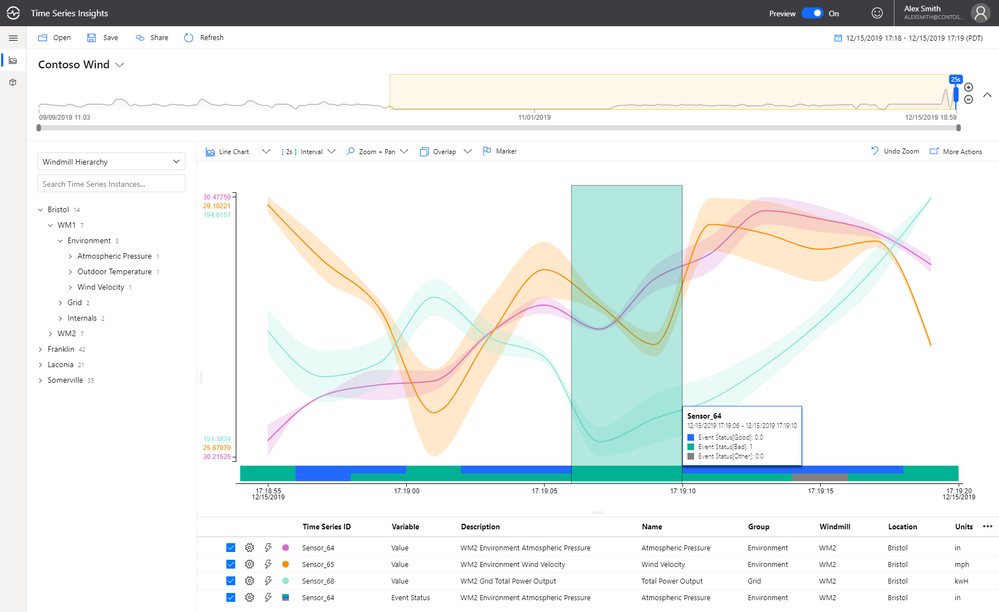
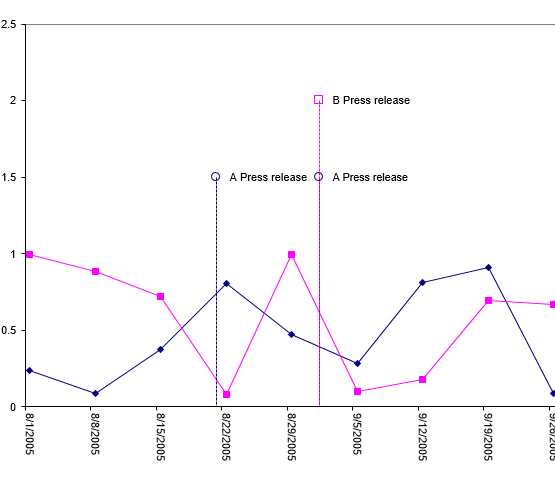
I would love to see the ability to put "pins" or "markers" for events on a time based chart. A lot of the work I'm doing with charts revolves around IoT, so we see a lot of value based data that needs to be contextualized with events. 

Example:

Event Labeling in Charts- Possible? - Microsoft Power BI Community

Unplanned
Last Updated: 11 Jan 2024 14:30 by ADMIN
Created by: Alexander
Comments: 11
Category: Charts
Type: Feature Request
13
I'm looking for a way to change the hover colors of the chart. Please allow customization of the highlighted series item.
Unplanned
Last Updated: 04 Dec 2023 09:41 by Mark
Created by: Benjamin
Comments: 1
Category: Charts
Type: Feature Request
6
I would like to reverse the labels on the Value Axis
Completed
Last Updated: 10 May 2022 17:33 by ADMIN
Release 3.3.0
Created by: Nadezhda
Comments: 2
Category: Charts
Type: Feature Request
2

Expose colored ranges (Plot Bands) to allow highlighting certain areas in the chart plot area - similar to https://demos.telerik.com/kendo-ui/bar-charts/plotbands.

---

ADMIN EDIT

---

This feature will allow you to define certain color ranges in the plot area. If you are looking for ability to color the whole plot area in alternating way, you may check this feature request - Is it possible to change the plot area background color in an alternating way.

Duplicated
Last Updated: 16 Mar 2022 11:44 by ADMIN
Created by: Chris1108
Comments: 0
Category: Charts
Type: Feature Request
18

Is there any plan to add an Org Chart as a control?

For reference - Kendo jQuery Org Chart.

The Org Chart should display the reports to / is a manager of relation (1:0,m) between employees and/or managers graphically.

Unplanned
Last Updated: 03 Jan 2022 14:55 by ADMIN
Created by: Andrew
Comments: 1
Category: Charts
Type: Feature Request
1
The current version of the tooltip template context contains the information for the series color, but a particular data point might have a different color. Exposing such an option will allow better customization of the tooltip.
Duplicated
Last Updated: 07 Jul 2023 07:29 by ADMIN
Created by: Andrew
Comments: 2
Category: Charts
Type: Feature Request
7

How do I stop a column chart generating over the hover-over effect?

The property exists in the Kendo Chart.

Unplanned
Last Updated: 22 Nov 2022 12:13 by ADMIN
Created by: Jesper
Comments: 4
Category: Charts
Type: Feature Request
12
I would like to customize the appearance of the Chart Legend
Unplanned
Last Updated: 06 Oct 2021 19:09 by ADMIN
Created by: Nikolas
Comments: 0
Category: Charts
Type: Feature Request
2

I would like a polar area chart.

Instead of

I want to have circular lines:

Unplanned
Last Updated: 07 Jan 2022 21:18 by Edward
Created by: Emil
Comments: 1
Category: Charts
Type: Feature Request
5
I would like to control the font of the value axis labels.
Unplanned
Last Updated: 25 Aug 2021 12:45 by ADMIN
I have 4 Radial Gauges and when I try to create a pdf with Kendo Drawing I am getting the following error: 

jQuery.Deferred exception: Cannot read property 'bbox' of undefined TypeError: Cannot read property 'bbox' of undefined.
Unplanned
Last Updated: 24 Aug 2021 14:59 by ADMIN
Created by: Kyle
Comments: 0
Category: Charts
Type: Feature Request
2
Expose Panes Functionality from the Chart Engine
Completed
Last Updated: 05 Aug 2021 15:03 by ADMIN
Created by: Bill Wolff
Comments: 1
Category: Charts
Type: Feature Request
0
I tried to add the OnSeriesClick to the chart definition and it allows this. When I click a bubble item, args is empty. Should this be supported? The user wants a bubble click to navigate to another page?
Duplicated
Last Updated: 29 Sep 2021 05:51 by ADMIN
Created by: Oleg
Comments: 2
Category: Charts
Type: Feature Request
2

It would be nice to be able to use Html markup in the ChartCategoryAxisLabel. 

I can see in the documentation that it currently doesn't support this. I am curious if it is possible. Thank you.