Hi
We would like to be able to draw a label for a group of series in the chart axis while also labelling the series individually. See the following example:
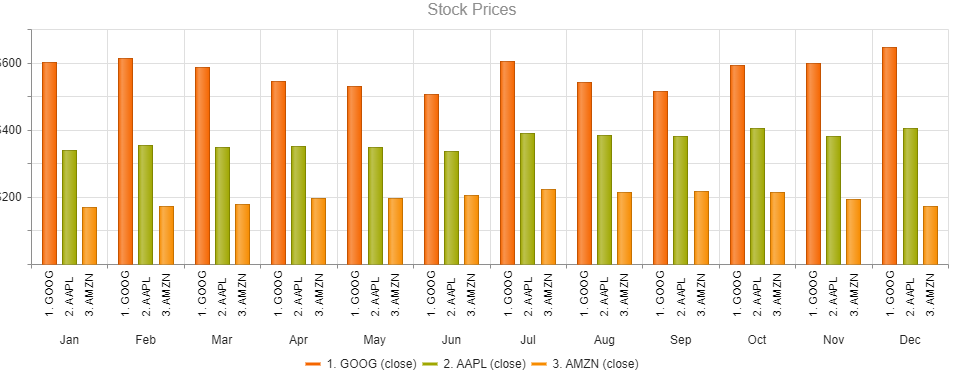
In Kendo UI you can achieve this: https://dojo.telerik.com/ulIJihIF. In Blazor, we can force the text into the chart axis categories, but we cannot seem to position them accurately, REPL.
Thank you
Hello,
Please consider a built-in way to add spacing (gaps, margins, etc.) between the segments of a Donut and Pie charts. The <ChartSeries> tag has such parameters, but they are used for other settings or other series types.
Currently, it is possible to achieve the desired appearance with custom CSS, but that requires knowledge about the Chart rendering.
Is it possible to use a different marker type other than the one provided by ChartSeriesMarkerType enum?
We would like to use a custom icon for some Scatter data but this doesn't seem to be supported out of the box. Please let us know if this is possible in the current framework, if not - can it be added as a feature?
Thanks,
Sean
Expose colored ranges (Plot Bands) to allow highlighting certain areas in the chart plot area - similar to https://demos.telerik.com/kendo-ui/bar-charts/plotbands.
---
ADMIN EDIT
---
This feature will allow you to define certain color ranges in the plot area. If you are looking for ability to color the whole plot area in alternating way, you may check this feature request - Is it possible to change the plot area background color in an alternating way.
I want horizontal and vertical lines in the chart to act as markers (limits, thresholds). It would be awesome if there was a way to simply draw a horizontal and vertical lines, bound to a collection of y and x data respectively.
Something like the below would be nice
<TelerikChart>
<ChartSeriesItems>
<ChartSeries Type="@ChartSeriesType.Line" Name="@P_Name1" Color="blue"
Data="@P_Data1"
Field="@P_Field1"
CategoryField="@P_CategoryField1">
<ChartSeriesLabels Visible="true" Template="#=dataItem.P_Description#" />
<ChartSeriesMarkers Size="4" />
</ChartSeries>
<ChartHorizontalLines Data="@YLinesData"/>
<ChartVerticalLines Data="@XLinesData"/>
</ChartSeriesItems>
</TelerikChart>
@code{
List<double> YLinesData, XLinesData;
}
---
ADMIN EDIT
You can find some more details and ideas for workarounds here to consider in the meantime.
---
I would like to control the font of the Value axis labels in a similar fashion to the way I can control the labels of the category axis:
    <ChartCategoryAxes>
        <ChartCategoryAxis Categories="@xAxisItems">
            <ChartCategoryAxisLabels Font="bold 12px 'Helvetica'"></ChartCategoryAxisLabels>
        </ChartCategoryAxis>
    </ChartCategoryAxes>
*** Thread created by admin on customer behalf ***
In need a chart that has a shaded area between a max and min set of curves, indicating the allowable area
Like this one: https://demos.telerik.com/kendo-ui/range-area-charts/index
The code below does not produce a chart series with a line that is 50 width? What am i missing?
@page "/chartdemo"
Line series
<TelerikChart>
<ChartSeriesItems>
<ChartSeries Type="ChartSeriesType.Line" Name="Product 1" Data="@series1Data">
<ChartSeriesMarkers Size="10"></ChartSeriesMarkers>
</ChartSeries>
<ChartSeries Type="ChartSeriesType.Line" Size="10" Name="Product 2" Data="@series2Data">
<ChartSeriesLine Width="50"></ChartSeriesLine>
</ChartSeries>
</ChartSeriesItems>
<ChartCategoryAxes>
<ChartCategoryAxis Categories="@xAxisItems"></ChartCategoryAxis>
</ChartCategoryAxes>
<ChartTitle Text="Quarterly revenue per product"></ChartTitle>
<ChartLegend Position="ChartLegendPosition.Right">
</ChartLegend>
</TelerikChart>
@code {
public List<object> series1Data = new List<object>() { 10, 2, 5, 6 };
public List<object> series2Data = new List<object>() { 5, 8, 2, 7 };
public string[] xAxisItems = new string[] { "Q1", "Q2", "Q3", "Q4" };
}
Hi!
I'm more than a little impressed with your Blazor efforts to-date, but there's one component lacking: a CandleStick chart.
Hi,
I would like to be able to show / hide a serie by clicking to a legend.
Is there a way to do it actually ?
What we are looking for is really just a means to change the legend text color, and other text colors, as well as being able to set a background.
For instance:
Through the Telerik theme we would not be able to do this, maybe on one chart, but not different styles for each of the 3 charts.
Possibly also having the chart to resize as the browser resizes, with an included Delay of 20ms. Just a thought.
It would be helpful to me if this chart type was supported.