radChartView1.AreaType = ChartAreaType.Cartesian;
var scatterSeries = new ScatterSeries();
scatterSeries.DataPoints.Add(new ScatterDataPoint(15, 19));
scatterSeries.DataPoints.Add(new ScatterDataPoint(18, 10));
scatterSeries.DataPoints.Add(new ScatterDataPoint(13, 15));
scatterSeries.DataPoints.Add(new ScatterDataPoint(10, 8));
scatterSeries.DataPoints.Add(new ScatterDataPoint(5, 12));
radChartView1.Series.Add(scatterSeries);
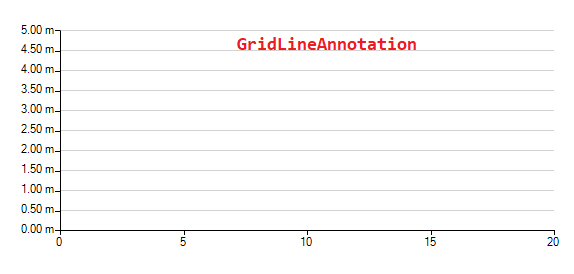
var verticalAxis = radChartView1.Axes.Get<LinearAxis>(1);
verticalAxis.Minimum = 0.0d;
verticalAxis.Maximum = 5.0d;
verticalAxis.MajorStep = 0.5d;
verticalAxis.LabelFormat = "{0:0.00} m";
for (var i = verticalAxis.Minimum; i <= verticalAxis.Maximum; i += verticalAxis.MajorStep)
{
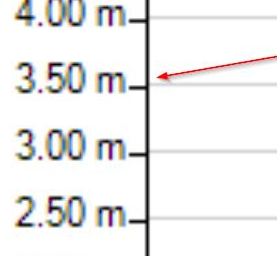
var annotation1 = new CartesianGridLineAnnotation();
annotation1.Axis = this.radChartView1.Axes[1] as CartesianAxis;
annotation1.BorderColor = Color.LightGray;
annotation1.BorderDashStyle = DashStyle.Solid;
annotation1.BorderWidth = 1;
annotation1.Value = i;
radChartView1.Annotations.Add(annotation1);
}Workaround:
        public RadForm1()
        {
            InitializeComponent();

            this.radChartView1.CreateRenderer += radChartView1_CreateRenderer;
            InitChart();
        }

        private void radChartView1_CreateRenderer(object sender, ChartViewCreateRendererEventArgs e)
        {
            e.Renderer = new CustomRenderer(e.Area as CartesianArea);
        }

        public class CustomRenderer : CartesianRenderer
        {
            public CustomRenderer(CartesianArea area) : base(area)
            {
            }

            protected override void InitializeAnnotations(AnnotationDrawMode drawMode)
            {
                for (int i = 0; i < this.Area.Annotations.Count; i++)
                {
                    if (this.Area.Annotations[i] is CartesianGridLineAnnotation && this.Area.Annotations[i].DrawMode == drawMode)
                    {
                        this.DrawParts.Add(new CustomCartesianGridLineAnnotationDrawPart(this.Area.Annotations[i] as CartesianGridLineAnnotation, this));
                    }
                }
            }
        }

        public class CustomCartesianGridLineAnnotationDrawPart : CartesianGridLineAnnotationDrawPart
        {
            public CustomCartesianGridLineAnnotationDrawPart(CartesianGridLineAnnotation element, CartesianRenderer renderer) : base(element, renderer)
            {
            }

            public override void Draw()
            {
                FieldInfo fi = typeof(CartesianGridLineAnnotation).GetField("model", BindingFlags.Instance | BindingFlags.NonPublic);
                ChartAnnotationModel model = fi.GetValue(this.Element) as ChartAnnotationModel;
                RectangleF rect = ChartRenderer.ToRectangleF(model.LayoutSlot);
                rect.Offset(this.ViewportOffsetX, this.ViewportOffsetY);
                rect.Offset(new PointF(0,1));
                Graphics graphics = this.Renderer.Surface as Graphics;
                RadGdiGraphics radGraphics = new RadGdiGraphics(graphics);

                Rectangle clipRect = ChartRenderer.ToRectangle(this.Element.View.GetArea<CartesianArea>().AreaModel.PlotArea.LayoutSlot);
                clipRect.Offset((int)this.ViewportOffsetX, (int)this.ViewportOffsetY);
                graphics.SetClip(clipRect);

                GraphicsPath path = new GraphicsPath();
                path.AddLine(rect.Location, new PointF(rect.Right, rect.Bottom));

                BorderPrimitiveImpl border = new BorderPrimitiveImpl(this.Element, null);
                border.PaintBorder(radGraphics, null, path, rect);

                rect.Size = graphics.MeasureString(this.Element.Label, this.Element.Font);
                rect.Offset(this.Element.PositonOffset.Width + 1, this.Element.PositonOffset.Height + 1);

                TextParams tp = new TextParams();
                tp.font = this.Element.Font;
                tp.foreColor = this.Element.ForeColor;
                tp.paintingRectangle = new RectangleF(rect.X, rect.Y, rect.Height, rect.Width);
                tp.text = this.Element.Label;

                FillPrimitiveImpl fill = new FillPrimitiveImpl(this.Element, null);
                fill.PaintFill(radGraphics, null, rect);

                radGraphics.DrawString(tp, new SizeF(rect.Height, rect.Width));
            }
        }
Improve performance, when calculating the positions of Smart Labels.
Public Class RadForm2
    Public Sub New()
        InitializeComponent()

        AddHandler Me.RadChartView1.CreateRenderer, AddressOf radChartView1_CreateRenderer

        Me.RadChartView1.ShowSmartLabels = True
        Me.RadChartView1.ShowPanZoom = True

        Dim barSeries As New BarSeries()
        Dim barSeries1 As New BarSeries()
        Dim barSeries2 As New BarSeries()
        Dim rand As New Random()
        barSeries.DataPoints.Add(New CategoricalDataPoint(101, 0))
        barSeries1.DataPoints.Add(New CategoricalDataPoint(101, 0))
        barSeries2.DataPoints.Add(New CategoricalDataPoint(101, 0))
        For i As Integer = 1 To 9
            barSeries.DataPoints.Add(New CategoricalDataPoint(rand.[Next](100), i))
            barSeries1.DataPoints.Add(New CategoricalDataPoint(rand.[Next](100), i))
            barSeries2.DataPoints.Add(New CategoricalDataPoint(rand.[Next](100), i))
        Next

        barSeries.ShowLabels = True
        barSeries.DrawLinesToLabels = True
        barSeries1.ShowLabels = True
        barSeries1.DrawLinesToLabels = True
        barSeries2.ShowLabels = True
        barSeries2.DrawLinesToLabels = True

        Me.RadChartView1.Series.Add(barSeries)
        Me.RadChartView1.Series.Add(barSeries1)
        Me.RadChartView1.Series.Add(barSeries2)
    End Sub

    Private Sub radChartView1_CreateRenderer(sender As Object, e As ChartViewCreateRendererEventArgs)
        'e.Renderer = New CustomCartesianRenderer(TryCast(e.Area, CartesianArea))
    End Sub
End Class


Workaround: Create a custom renderer
Public Class CustomCartesianRenderer
    Inherits CartesianRenderer
    Public Sub New(area As CartesianArea)
        MyBase.New(area)
    End Sub

    Protected Overrides Sub Initialize()
        MyBase.Initialize()

        For i As Integer = 0 To Me.DrawParts.Count - 1
            Dim labelPart As BarLabelElementDrawPart = TryCast(Me.DrawParts(i), BarLabelElementDrawPart)
            If labelPart IsNot Nothing Then
                Me.DrawParts(i) = New CustomBarLabelElementDrawPart(DirectCast(labelPart.Element, BarSeries), Me)
            End If
        Next
    End Sub
End Class

Public Class CustomBarLabelElementDrawPart
    Inherits BarLabelElementDrawPart
    Public Sub New(owner As ChartSeries, renderer As IChartRenderer)
        MyBase.New(owner, renderer)
    End Sub

    Public Overrides Sub Draw()
        Dim graphics As Graphics = TryCast(Me.Renderer.Surface, Graphics)
        Dim cartesianSeries As CartesianSeries = TryCast(Me.Element, CartesianSeries)
        If cartesianSeries IsNot Nothing Then
            Dim area As CartesianArea = DirectCast(cartesianSeries.[GetType]().GetField("area", BindingFlags.Instance Or BindingFlags.NonPublic).GetValue(cartesianSeries), CartesianArea)
            Dim clipRect As RectangleF = DirectCast(area.[GetType]().GetMethod("GetCartesianClipRect", BindingFlags.Instance Or BindingFlags.NonPublic).Invoke(area, New Object() {}), RectangleF)

            graphics.SetClip(clipRect)
        End If

        MyBase.Draw()

        graphics.ResetClip()
    End Sub

    Protected Overrides Function GetLineStart(label As LabelElement, point As DataPointElement, isSmartLabel As Boolean) As PointF
        Dim lineStart As PointF = MyBase.GetLineStart(label, point, isSmartLabel)

        Dim x As Single = CSng(TryCast(Me.Element.View, IChartView).PlotOriginX)
        Dim y As Single = CSng(TryCast(Me.Element.View, IChartView).PlotOriginY)

        lineStart.X += x
        lineStart.Y += y

        Return lineStart
    End Function

    Protected Overrides Function GetLineEnd(label As LabelElement, point As DataPointElement, isSmartLabel As Boolean) As PointF
        Dim lineEnd As PointF = MyBase.GetLineEnd(label, point, isSmartLabel)

        If Not isSmartLabel Then
            Dim x As Single = CSng(TryCast(Me.Element.View, IChartView).PlotOriginX)
            Dim y As Single = CSng(TryCast(Me.Element.View, IChartView).PlotOriginY)
            lineEnd.X += x
            lineEnd.Y += y
        End If

        Return lineEnd
    End Function
End Class
Note: similar to the axis, the series should also have ClipLabels property which will control whether the labels will be clipped or not.

How to reproduce: zoom and pan along the chart
public Form1()
{
    InitializeComponent();

    this.radChartView1.CreateRenderer += radChartView1_CreateRenderer;
    this.radChartView1.ShowPanZoom = true;

    BarSeries barSeries = new BarSeries();
    Random rand = new Random();
    for (int i = 1; i < 10; i++)
    {
        barSeries.DataPoints.Add(new CategoricalDataPoint(rand.Next(100), i));
    }

    barSeries.ShowLabels = true;
    this.radChartView1.Series.Add(barSeries);
}

Workaround:
 public partial class Form1 : Form
 {
     public Form1()
     {
         InitializeComponent();

         this.radChartView1.CreateRenderer += radChartView1_CreateRenderer;
         this.radChartView1.ShowPanZoom = true;

         BarSeries barSeries = new BarSeries();
         Random rand = new Random();
         for (int i = 1; i < 10; i++)
         {
             barSeries.DataPoints.Add(new CategoricalDataPoint(rand.Next(100), i));
         }

         barSeries.ShowLabels = true;
         this.radChartView1.Series.Add(barSeries);
     }

     private void radChartView1_CreateRenderer(object sender, ChartViewCreateRendererEventArgs e)
     {
         e.Renderer = new CustomCartesianRenderer(e.Area as CartesianArea);
     }
 }

 public class CustomCartesianRenderer : CartesianRenderer
 {
     public CustomCartesianRenderer(CartesianArea area)
         : base(area)
     { }
     protected override void Initialize()
     {
         base.Initialize();

         for (int i = 0; i < this.DrawParts.Count; i++)
         {
             BarLabelElementDrawPart labelPart = this.DrawParts[i] as BarLabelElementDrawPart;
             if (labelPart != null)
             {
                 this.DrawParts[i] = new CustomLabelElementDrawPart((BarSeries)labelPart.Element, this);
             }
         }
     }
 }

 public class CustomLabelElementDrawPart : BarLabelElementDrawPart
 {
     public CustomLabelElementDrawPart(ChartSeries owner, IChartRenderer renderer)
         : base(owner, renderer)
     { }

     public override void Draw()
     {
         Graphics graphics = this.Renderer.Surface as Graphics;
         CartesianSeries cartesianSeries = this.Element as CartesianSeries;
         if (cartesianSeries != null)
         {
             CartesianArea area = (CartesianArea)cartesianSeries.GetType().GetField("area", BindingFlags.Instance | BindingFlags.NonPublic).GetValue(cartesianSeries);
             RectangleF clipRect = (RectangleF)area.GetType().GetMethod("GetCartesianClipRect", BindingFlags.Instance | BindingFlags.NonPublic).Invoke(area, new object[] { });//.GetCartesianClipRect();
             graphics.SetClip(clipRect);
         }

         base.Draw();

         graphics.ResetClip();
     }
 }
Good day,
My requierment is to have a RadChartView with a LineSeries and a RangeSeries. I add CategoricalDataPoint objects manually to the LineSeries and I manually add RangeDataPoint objects to the RangeSeries.
When I encounter NULL valued datapoints, for the LineSeries, I do the following. The NULL valued datapoints appear as gaps in the chart as expected.
Dim value As Nullable(Of Double)
Dim serControl  As  LineSeries

serControl = New LineSeries()
chart.Series.Add(serControl)
value = IIf(IsDBNull(dr(data.ControlParameter.ID.ToString())), New Nullable(Of Double), dr(data.ControlParameter.ID.ToString()))
serControl.DataPoints.Add(New Telerik.Charting.CategoricalDataPoint(value))
However the RangeSeries do not handle the NULL valued datapoints the same. I get the following error: Nullable object must have a value.
Dim LowerBound, UpperBound As Nullable(Of Double)
Dim serRange  As  RangeSeries

serRange = New RangeSeries()
chart.Series.Add(serRange)
LowerBound = IIf(IsDBNull(dr("Lowerbound"), New Nullable(Of Double), dr("LowerBound"))
UpperBound = IIf(IsDBNull(dr("Upperbound"), New Nullable(Of Double), dr("UpperBound"))
serRange.DataPoints.Add(New Telerik.Charting.RangeDataPoint(UpperBound, LowerBound))
I need to be able to show gaps, not zero's in a RangeSeries when there are NULL values.
How can I do this?
I need to draw a series of graphs and show the legend. When the legend does not fit in the RadChartView, a scroll bar appears - this is acceptable, you can quickly see the whole legend. But the title of the legend is cut off.
Currently, RadChartView offers exporting to a Bitmap in one of the following formats: https://docs.microsoft.com/en-us/dotnet/api/system.drawing.imaging.imageformat?view=netframework-4.8
It would be nice to have export functionality to a vector image.
Please refer to the attached sample project. Select a range from RadRangeSelector and print the chart. You will notice that the preview chart is shifted. Even if the the default margin is reduced to 0, the preview chart is not the same as the one displayed on the form.
Workaround: export the chart to a file which file can be printed: https://docs.telerik.com/devtools/winforms/controls/chartview/features/export
When setting the border color of the axis the labels are showing a border with the same color. The color is inherited from the axis element. One should be able to easily disable this, or it should not happen.

How to reproduce:
public partial class RadForm1 : Telerik.WinControls.UI.RadForm
{
    LineSeries lineSeries;

    public RadForm1()
    {
        InitializeComponent();

        this.lineSeries = new LineSeries();

        this.lineSeries.DataPoints.Add(new CategoricalDataPoint(20, "Jan"));
        this.lineSeries.DataPoints.Add(new CategoricalDataPoint(22, "Apr"));
        this.lineSeries.DataPoints.Add(new CategoricalDataPoint(25, "Jul"));
        this.lineSeries.DataPoints.Add(new CategoricalDataPoint(19, "Oct"));

        this.radChartView1.Series.Add(this.lineSeries);

        this.lineSeries.HorizontalAxis.BorderColor = Color.Green;
        this.lineSeries.VerticalAxis.BorderColor = Color.Blue;
    }
}

Workaround: iterate each of the axis labels and set their border color to Transparent
public partial class RadForm1 : Telerik.WinControls.UI.RadForm
{
    LineSeries lineSeries;

    public RadForm1()
    {
        InitializeComponent();

        this.lineSeries = new LineSeries();

        this.lineSeries.DataPoints.Add(new CategoricalDataPoint(20, "Jan"));
        this.lineSeries.DataPoints.Add(new CategoricalDataPoint(22, "Apr"));
        this.lineSeries.DataPoints.Add(new CategoricalDataPoint(25, "Jul"));
        this.lineSeries.DataPoints.Add(new CategoricalDataPoint(19, "Oct"));

        this.radChartView1.Series.Add(this.lineSeries);

        this.lineSeries.HorizontalAxis.BorderColor = Color.Green;
        this.lineSeries.VerticalAxis.BorderColor = Color.Blue;
    }

    protected override void OnShown(EventArgs e)
    {
        base.OnShown(e);

        foreach (var item in this.lineSeries.VerticalAxis.Children)
        {
            AxisLabelElement label = item as AxisLabelElement;
            if (label != null)
            {
                label.BorderColor = Color.Transparent;
            }
        }

        foreach (var item in this.lineSeries.HorizontalAxis.Children)
        {
            AxisLabelElement label = item as AxisLabelElement;
            if (label != null)
            {
                label.BorderColor = Color.Transparent;
            }
        }
    }
}
Hi team,
We need a ChartView with multiple series and multiple Y-axis. The axis color of each Y-axis should be automatically painted according to the palette setting (thank you for the brilliant work - it's very intuitive). However, if clear the series and re-assign a new set of series, the border color of the first axis changes to black, regardless which palette is active. If the palette is set to a new one, the border color can be re-painted correctly. See screenshot as attached.
How to reproduce: Please refer to the attached project for a demo of reproduction. Click the first button to populate new random data. The border color of the first axis should change to black after clicking the button twice and more times. Clicking the second button will force the palette to change and the border color will become normal.
Thank you, team.
Best,
Yusi
When you have BarSeries and LineSeries in RadChartView the problem is that the DataPoint.Presenter is always BarSerries, never LineSeries.
To workaround, create custom renderer:
this.radChartView1.CreateRenderer += this.RadChartView1_CreateRenderer;
private void RadChartView1_CreateRenderer(object sender, ChartViewCreateRendererEventArgs e)
{
    e.Renderer = new CustomCartesianRenderer(e.Area as CartesianArea);
}

public class CustomCartesianRenderer : CartesianRenderer
{
    public CustomCartesianRenderer(CartesianArea area)
        : base(area)
    { }
    public override DataPoint HitTest(int x, int y)
    {
        for (int i = this.DrawParts.Count - 1; i >= 0; i--)
        {
            DataPoint dataPoint = this.DrawParts[i].HitTest(new Point(x, y));
            if (dataPoint != null)
            {
                return dataPoint;
            }
        }

        return base.HitTest(x, y);
    }
}
Hi Team,
Can you please share sample or demo code for candlestick graph (C# winform).
Thanks
Use attached to reproduce.
- Click at least 7 times.
Workaround: Crete new series instance each time.
Stack trace:
System.NullReferenceException occurred
HResult=-2147467261
Message=Object reference not set to an instance of an object.
Source=Telerik.WinControls.ChartView
StackTrace:
at Telerik.Charting.CombinedBarSeriesRoundLayoutStrategy.ApplyLayoutRoundingVertical(LayoutContext context) in c:\Work\Development\RadControls\RadChartView\Engine\Series\Combination\BarSeries\CombinedBarSeriesRoundLayoutStrategy.cs:line 206
InnerException:
Inside the constructor of a form create a pie series and populate it with data. Then add it to a RadChartView. You will notice that there are two legend items per data point.