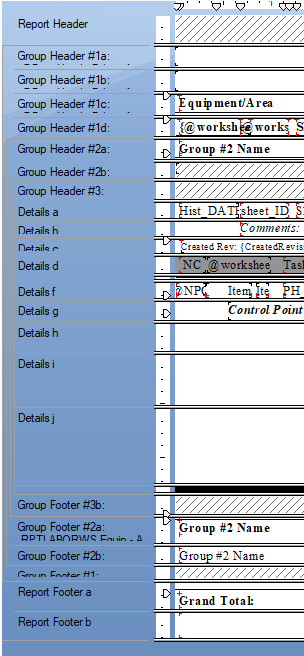
Ability to split sections for use in Conditions and Formatting.
Example: Detail split into Detail-A and Detail-B where either or both may display based on a condition defined at the Section Split level.
For Crystal Report users (myself since 2008) this is a very important feature.
It allows a single report be used for detail or summary reporting as well as multiple conditions for display.
This is an example from CR:
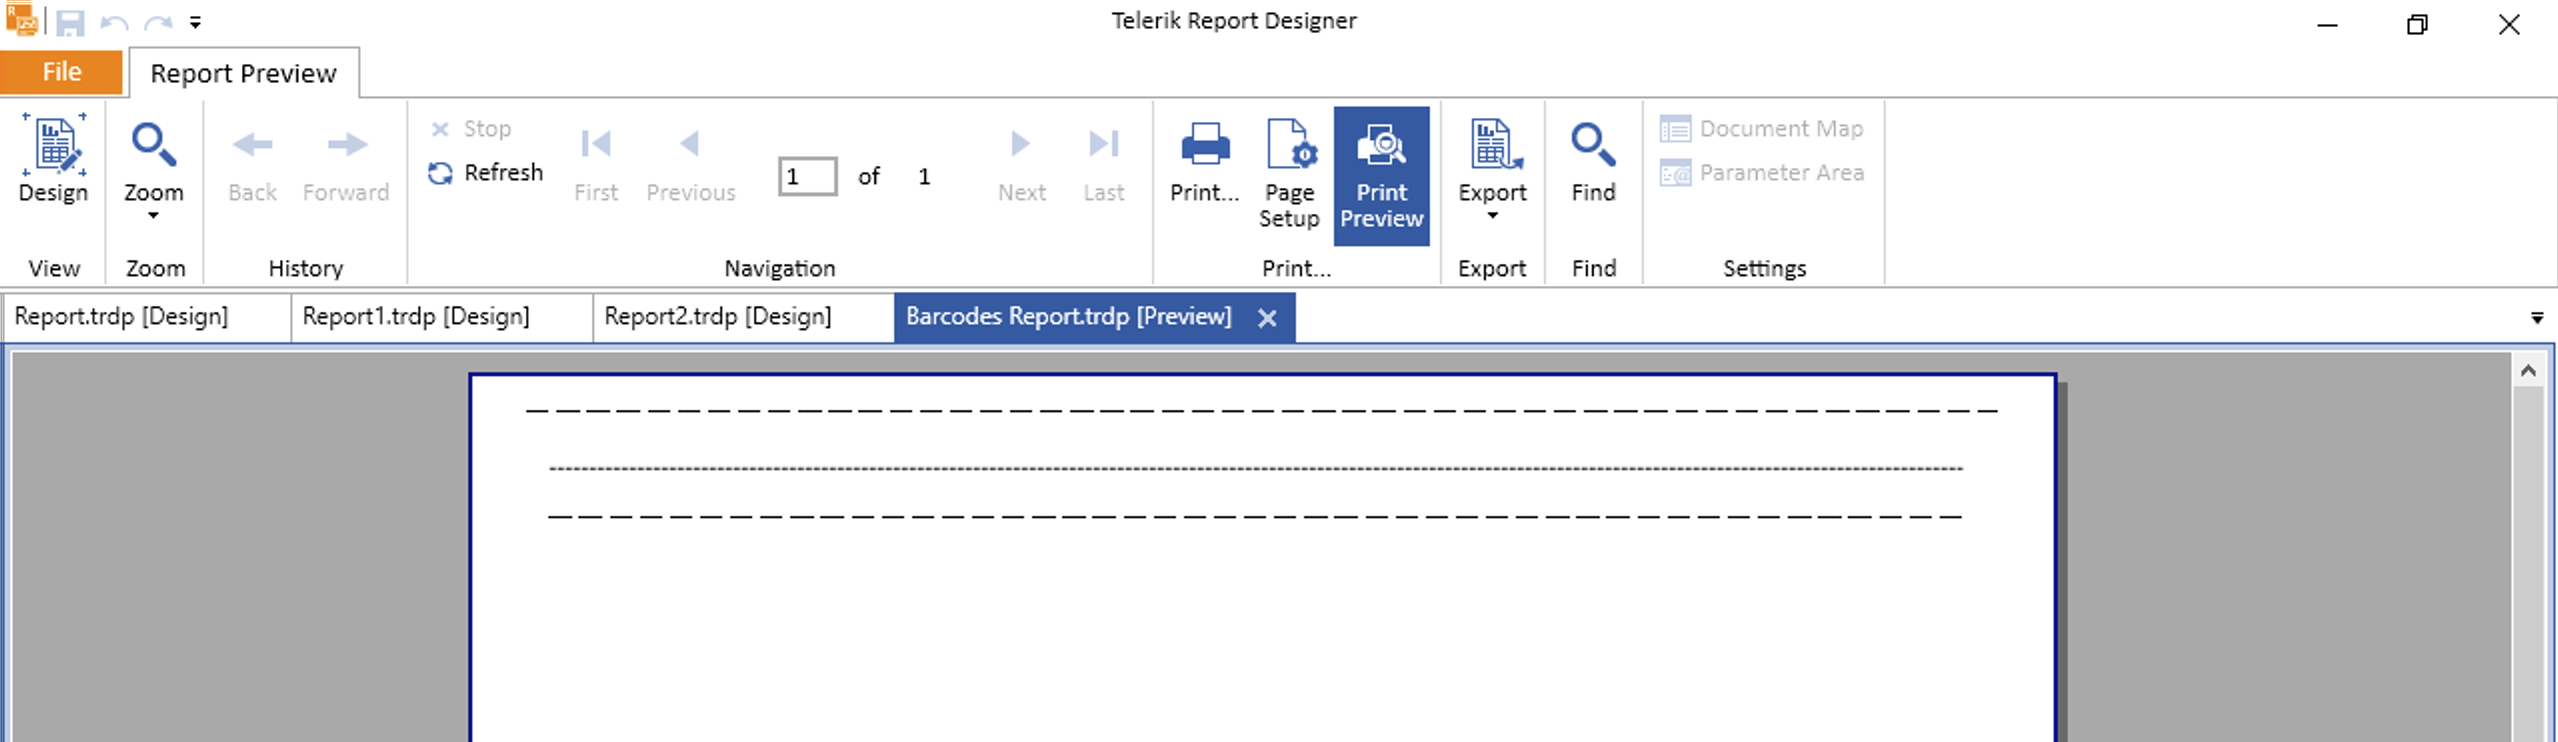
When I display the page count in PrintPreview mode with the following function, the result depends on the value of the Report property SkipBlankPages and may be wrong:
= PageCount("Report1", 1)If I use only:
= PageCount
the result is correct.
The linked PageCount video demonstrates the problem.
When a Report Parameter is Nullable, and the Null value comes from the data source, for example, from a JsonDataSource assigned to the parameter AvailableValues, the Desktop viewers don't recognize this value and show an exception that the parameter value is not valid. You need to check the NULL checkbox to set the parameter value to Null.
In the Html5 Viewer, the same is working as expected, and the Null value from the data source is correctly set directly to the parameter.
The link to the Nullable Parameter video demonstrates the issue.
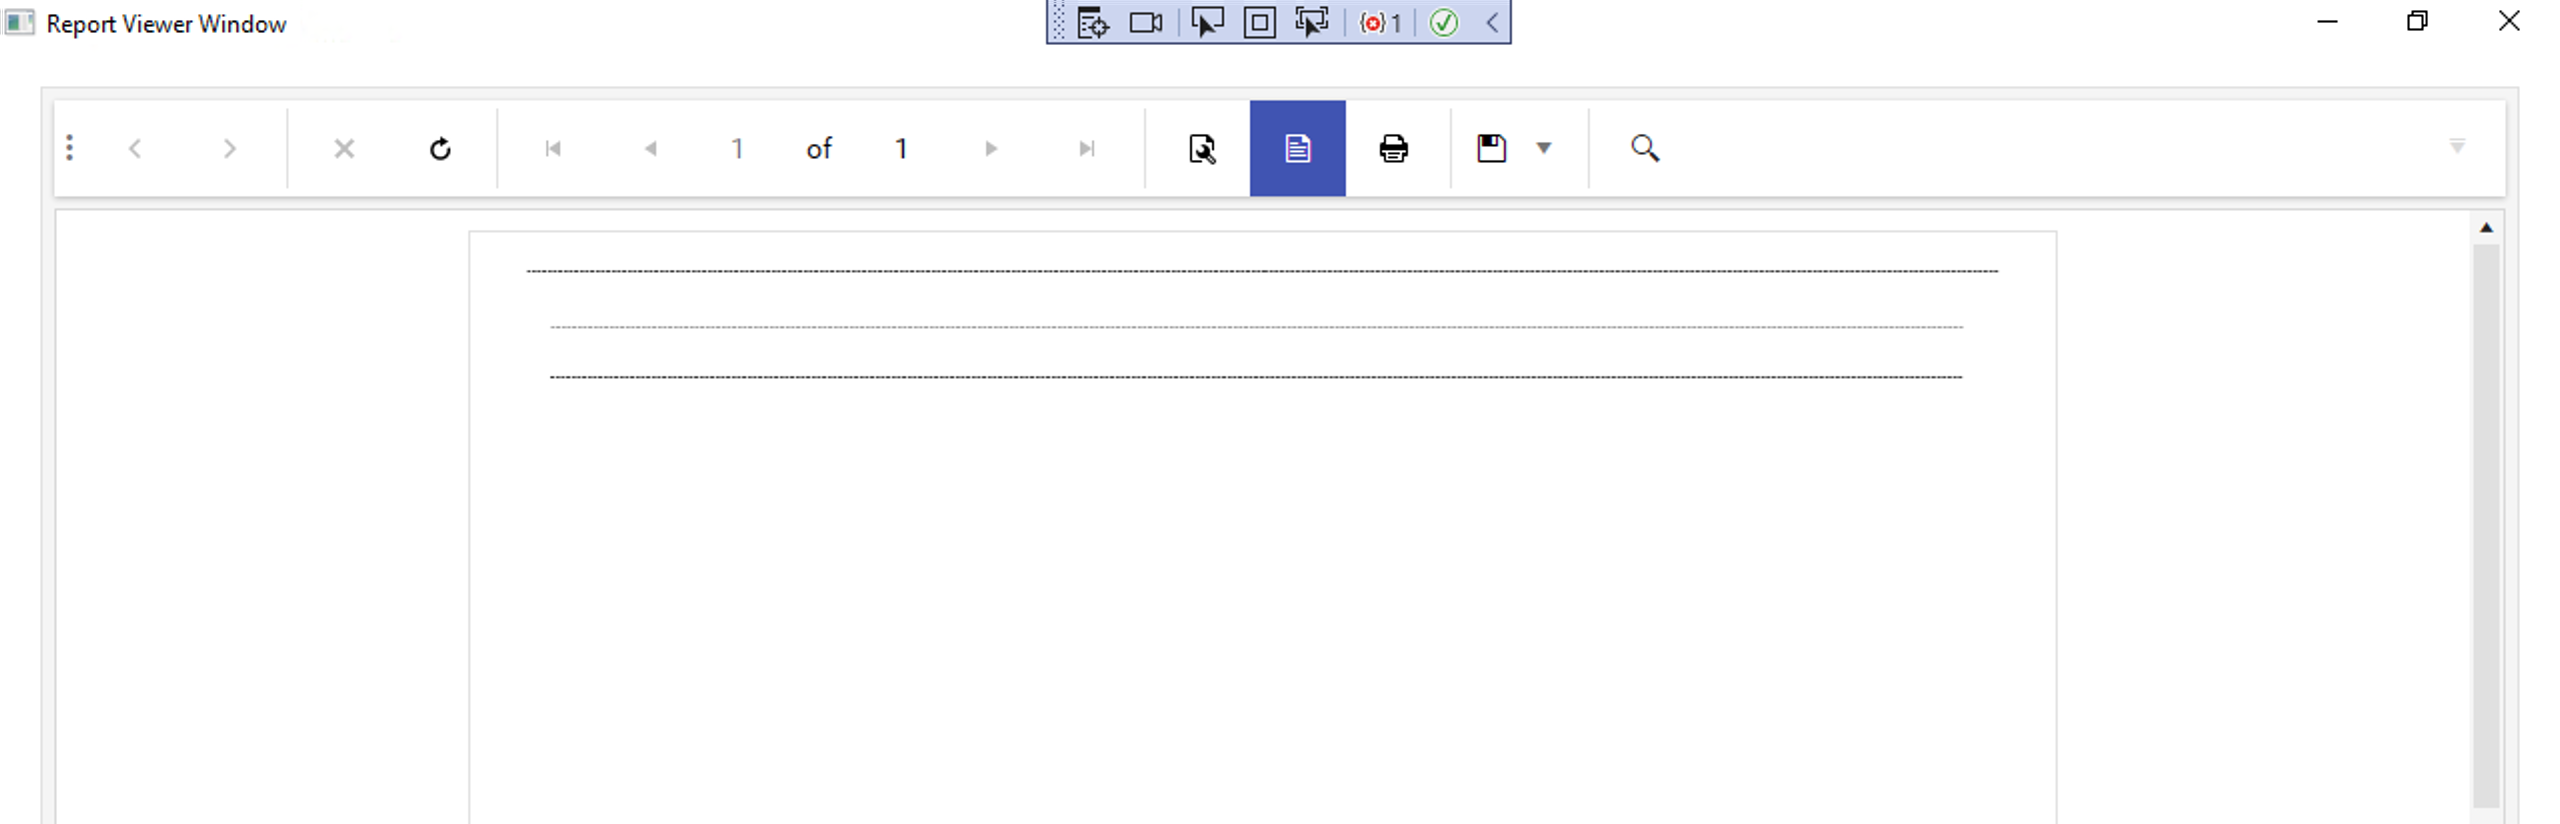
This is the outcome in the Standalone designer:
This is the outcome in the WPF viewer:
Currently, when GroupFooterSection.PrintAtBottom is set to True, all subsequent sections will be moved to the next page. For that reason, the Report Footer also moves to another page even when its PrintAtBottom is True and both sections can fit on a single page.
If I set the Group Footer PrintAtBottom to False, it will be printed just below the Detail section, which may leave unwanted blank space between the Group Footer and the Report Footer.
I think that it is more intuitive to have both the Group Footer and the Report Footer printed at the bottom of the last page in this scenario, with the Group Footer just above the Report Footer.
While export/render a Report to PDF the pictures keep their original size, even when they are very big. Pictures scaled to a small image include the full-size image in PDF.
To keep the PDF smaller, all pictures needs to be resized in advance/by program at the moment.
Please implement the possibility (Activatable by Parameter) to automatically resize the images to the needed size
- for the used DPI settings in report
- or to a new added PictureDPI.
The Angular Report Viewer uses the jQuery npm package, while the Web Report Designer uses jQuery.min.js directly from a CDN. If you try to use both Angular Viewer and JS Web Designer in the same application there will be a conflict while loading jQuery twice from the different sources. This is why the Angular Report Viewer cannot be loaded together with the JS Web Report Designer in the same application. The KB article Displaying the Web Report Designer in Angular application provides a Known Issues section at the bottom where this problem is explained:
"Telerik Web Report Designer could not be integrated into Angular application together with Angular Telerik Report Viewer. That is why this article shows how to use the Telerik Web Report Designer in angular application with jQuery-based HTML5 Telerik Report Viewer."
I have a TextBox that is rotated at 270 degrees. Its width in some cases is not enough to accommodate the incoming value. I expected it to grow vertically (i.e. in width) in this case. However, its width didn't grow. It just cut the content.
I noticed that if I increased the height of the TextBox, the content was wrapped horizontally.
Hi,
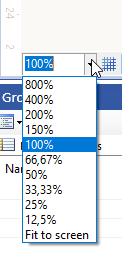
Does the Web Report Designer support zooming of the report area? Similar to the Standalone designer:
Best regards,
Magnus
If you shrink the browser showing the Blazor viewer, initially the menu toolbar doesn't respond and the right-most menu items get cut. When you continue to reduce the browser width, at some point, the menu becomes responsive and the small menu appears.
The above behavior is reproducible with the Blazor demo application for .NET 6. The problem is not related to the pure Html5 Report Viewer.
I have a SubReport in my main report detail section. The TextBox above the SubReport has TocText. The subreport also has items with TocText.
In the final TOC of the main report, the subreport items appear before the main report TextBox, although they are rendered after it.
If I move the main report TextBox from the detail section to the Report Header or Report Group Header section, the TOC order is correct.
Please see ticket #1553960 for examples and the initial ticket.
Request: Update isValidXhtml to take in an optional argument that controls whether or not the validation ignores unsupported HTML tags. With the understanding that unsupported tag types do not get output in the HtmlTextBox.
Because the function isValidXhtml evaluates to False for unsupported tag types while the HtmlTextBox just ignores unsupported tag types, there is a disconnect between what the HtmlTextBox can display vs what isValidXhtml allows to be displayed.
This change would allow more flexibility when trying to validate HTML and display it in the HtmlTextBox.
Use case: I have been working a lot with emails and trying to display them within a report. When I use isValidXhtml to validate the email before outputting in an HtmlTextBox, most emails evaluate to False and do not get displayed since they contain many unsupported tag types. However when I remove the validation, more emails get displayed because the HtmlTextBox ignores unsupported tag types. This update would allow more HTML to be considered "valid" by the isValidXhtml function, with the understanding that unsupported tag types will not get displayed.
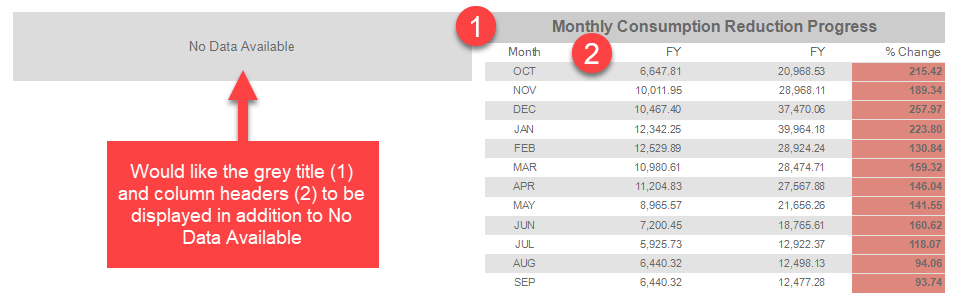
It would be helpful to enable printing a table header when no data is available and the NoDataMessage is set. We frequently have tables with one or more static headers that may not have any data - depending on the supplied report parameters. We set the NoDataMessage to display an appropriate message, however, we would like to continue displaying the table title and column headers.
We currently accomplish this with a Panel + Table but that is inelegant. It is more designer friendly to design the table once and reposition and resize it as necessary.
Here is an example screenshot of the issue we have now
I have a report with a Graph with BarSeries and DateTime X-axis and Numerical Y-axis. The Series has ToolTip that is displayed correctly in the Standalone Report Designer. However, the Html5 Report Viewer does not display the tooltips. The HTML element for the bars does not contain the needed attributes:
data-tooltip-title="Value" data-tooltip-text="10" data-role="tooltip"
and looks like this:
<path d="M588.32 51.51 L589.05 51.51 L589.05 242.89 L588.32 242.89 Z" fill="none" stroke="lime" stroke-width="2" stroke-dasharray="none" stroke-linejoin="bevel" stroke-linecap="butt"></path>