I have created an ellipse shape item and have set its Stretch property to True. Then, I have set the width of the item to be 1.5in, while the height is 1in, which results in a horizontally stretched ellipse on design-time:
However, when I render the report on Linux where the Skia graphics engine is used, the shape is not rendered properly:


We are using "@progress/telerik-angular-native-report-viewer": "29.26.211"
Seems options Fit to page/Fit to width are mixed
Fit to page does what Fit to width should be doing and vice versa
Currently, the desktop viewers don't allow adding custom headers to their requests to the service.
In HTML5-based web viewers, this is possible through the AjaxPrefilter event.
Currently, if the SkipBlankPages property is set to True and there is not any significant content in the report, the following message will be displayed in the designer and the viewer: The current data set presented in the report did not produce any significant content, so no pages were generated. If you need to see the whole report content, including blank pages, please contact the report author.
I use the kendovalidator before rendering the report to check the correct parameter of initial and final date.
However, the validation fails because additional inputs (for the "Send Email" functionality) are included in the HTML output of the viewer even though I have disabled it.
I believe that if the "Send Email" option is disabled the mail data panel should not be created.
In the Report Book’s Edit Parameters dialog, non‑mergeable parameters only show index 0 in the dropdown, even when multiple report instances are present:
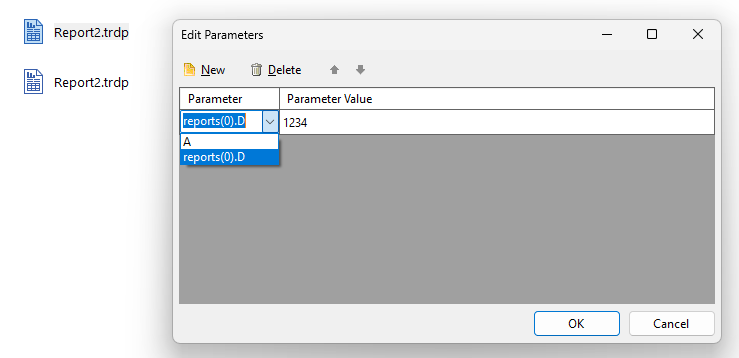
Other indexes can be applied only by manually typing the value into the combo box, but this behavior is not intuitive and makes it unclear that parameters can be assigned per instance.
in the expression editor i have a html tag like this...
<ol style="list-style-type: lower-roman" start="2">
design view on the expression editor correctly shows the indented list starting with ii (2).
On the main report view and print, it only shows as i (1).
Yet any editing it switches back to ii (2);
---
Comment from admin: The HtmlTextBox item does not (yet) support the `start` attribute (please check Styling and Formatting HtmlTextBox). Therefore, the result in the report preview/print is the expected one, while the design view is misleading.
Our clients enter information using the radeditor and in many cases want to embedded tables and graphics into their text. Using your reporting tool there is no way to print this information. I know you have suggested using your table and image tools, but that doesn't work when you are dealing with freely formatted text so the existance and location of the tables and images cannot be predicted.
After reviewing other users questions/issue it appears this hasn't been addressed.
When creating a TABLE group (not a group header/footer) the TABLE group header has no option of displaying on each page when the group spans multiple pages. The advice to make ColumnHeaders = True doesn't help because when you add a group header that row is inserted below the table's header row and thus this doesn't apply to the group header row.
I'd like to suggust a setting in the table group properties menu to display the header on each page, ideally with an option to display a suffix such as "cont."
When I invoke a cancellation before the report processing starts, the expected behavior is that the report should really not even begin processing, but it runs to completion.
When I export to XLSX, RTF, and CSV formats, and try to cancel the report a few seconds later, so that cancellation is signaled while report processing is already occurring, it doesn't stop. The expected behavior is that a TaskCanceledException should be raised, and the report processing should stop, but the report runs to completion. In PDF, DOCX, and PPTX, this works as expected.
we need to have complete End User Tutorial for Web Report Designer, where all the excel like features need to be demonstrated.
including Pivot etc.
Currently, Telerik Reporting has a dependency on Microsoft.Data.SqlClient version="5.2.2".
This version may cause build failure when restoring packages due to locked package files.
See the following dotnet issue for more information about the problem: dotnet/SqlClient#2464
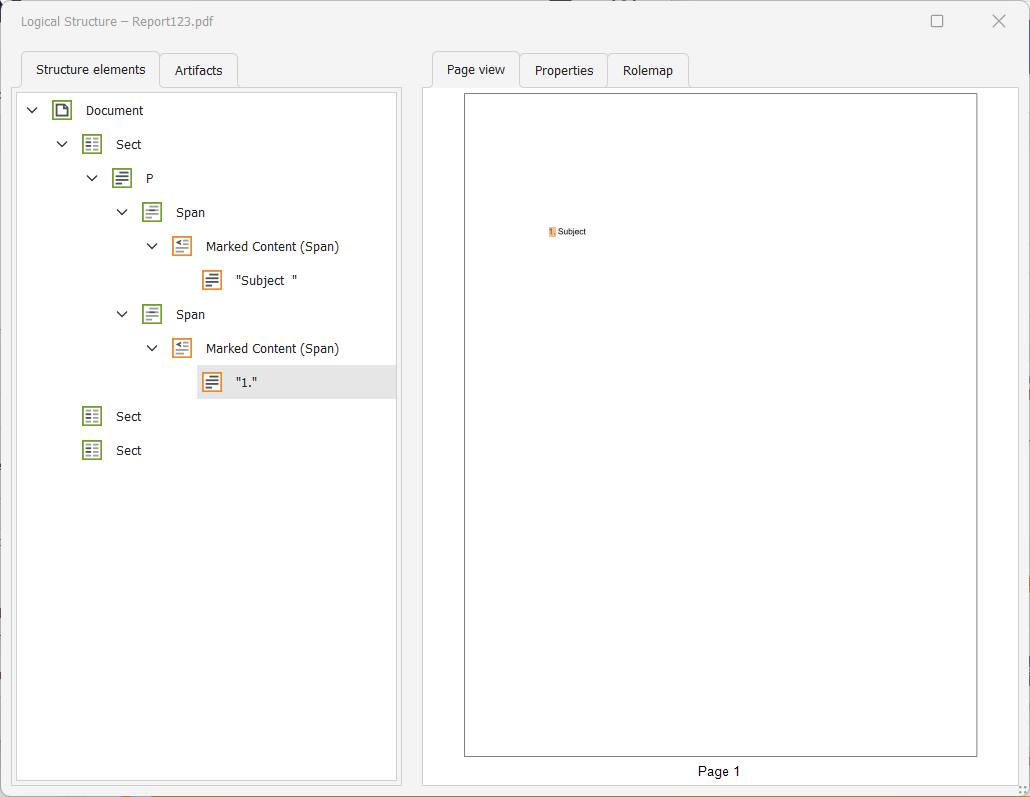
I have a report with an HtmlTextBox item, which contains an ordered list(<ol>). When I export this report to PDF, and inspect the logical tree of the document with a tool like the PDF Accessibility Checker, I can see that the span with the text is inserted above the number.
As a result, when I read the document with a screen-reading tool like Adobe's "Read Out Loud" feature or NVDA, the text is read before the current number in the list, which I find unexpected.
Description
Even though there is no map wizard for the WRD, it is possible to create a map item and try to set it. However, it is not possible to select an ESRI Shapefile for the spatial data or inspect the already existing one in the report:

Steps To Reproduce
- Use the PopulationDensity report
- Open the ShapeMapSeries:

- The Source type can't be configured:

Expected behavior
Even with no map wizard in the WRD, the map item should be created from scratch, and all properties should be editable.
Actual behavior
The Source Type doesn't show any option for selecting shape files.
Hi, our project uses the Telerik Report Service with Asp .NET Core with Keycloak as Session Provider, every time the user tries to use an Report, after some time, he gets Unauthorized error.
To solve this I've implemented a way to specify the login promise (that is called before each request) when starting the HTML5 Report Viewer.
What if it becomes an native feature?
I have a Website ASP.NET project, and I am trying to implement the Reporting REST Service in it. To do that, I have tried to install the Telerik.Reporting.Services.WebApi package to my solution. However, when I attempt that, I get the following error:
The package 'Telerik.Reporting.Services.WebApi' tried to add a framework reference to 'System.Web.Http' which was not found in the GAC. This is possibly a bug in the package. Please contact the package owners for assistance.
Cannot find assembly 'System.Web.Http'.
It seems that the package requires that the System.Web.Http.dll assembly is available in the GAC, otherwise, the package cannot be installed.
The workaround to be able to install the package is to manually install the assembly to the GAC, or paste it in C:\Program Files (x86)\Reference Assemblies\Microsoft\Framework\.NETFramework\v4.8.