Greetings

Please add this feature (Persian Calendar) into a valuable package

Thanks to the team
There are situations where I want to know more about what triggered certain event in kendo (for example if ctrl button was down when clicking) but library won't let me because original browser events don't make it all the way up. Examples:
* select/change event for tree view
* change event for grid
I wish there was a field originalEvent on the argument so I can look at it.
element.kendoTreeView(
{
    select: e =>
    {
        let isCtrlDown = e.originalEvent.ctrlKey;
    }
});Hi,
I have a grid. from which if the user selects multiple rows, we want to display corresponding PDF files into PDF viewer. I have checkbox as 1st column of the grid. It will be great if there is an API method that would allow the loading of multiple files.
Add a new control to edit filters/queries like in Visual Studio online (see "How to: Design a Query by Using the Query Designer", https://msdn.microsoft.com/en-us/library/ff852016.aspx)
Hi,
I'm using the Grid version 2019.3.1023 but changelog for newer version doesn't seem to show this has been fixed.
Using Html.Kendo().Grid().Columns(columns => colums.ForeignKey(x => x.ForeignCol, data, "value", "label"));
If data contains html, it will not be escaped when the javascript for the kendoGrid component is rendered, and thus is exposed to XSS.
This should be either fixed or documentation and samples must tell explicitly we need to html encoded the data, as this is not the case for the model itself.
I would like the additional barcode added.

https://en.wikipedia.org/wiki/Data_Matrix

A Data Matrix is a two-dimensional barcode consisting of black and white "cells" or modules arranged in either a square or rectangular pattern, also known as a matrix.
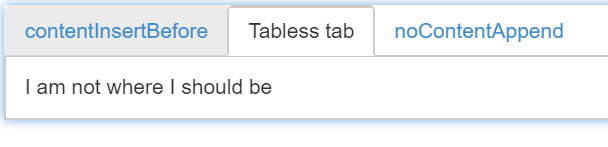
Step by step instructions on how to reproduce the problem:
- Create a kendo tab strip
- Using the append method, add a "tab1"- do not specify any content in this new tab
- Using the insertBefore method, add a "tab2", this time specify some content
- Attempt to navigate the tabs and note what is showing in the content of each tab
Code snippets:
            var tabStrip = $("#contentlessAppend").kendoTabStrip({}).data('kendoTabStrip');
            tabStrip.append({
              text: "noContentAppend",
              //content: "With content" //Uncomment this line for normal functionality
            });
            tabStrip.insertBefore({
              text: "contentInsertBefore",
              encode: false,
              content: `<div id="WhereAmI">I am not where I should be</div>`
            }, tabStrip.tabGroup.children().eq(0) );
Screenshots of the problem:
Stack trace, if applicable: N/A
Project and its dependencies which illustrates the problem (stripped, in zip format):
(see attached)
Need to have simple textbox (input) widget
As a developer, I want to be able to add paragraphs with empty content and not have it stripped, so that I can add custom functionality, like icons.
I want to be able to control if the paragraph's content should be stripped or have the editor allow empty elements when they have classes.
Currently, if I add markup similar to a font awesome icon or some custom icon in a paragraph, there is a function, _fillEmptyElements, that strips the content of the paragraph:
Input:
<p> <i class="fa fa-check" style="color: green;"></i> </p>or
<p> <span class="customicon icon-iconname"></span> </p>
On save, the paragraph's content is stripped to:
<p> </p>
As a workaround, I can add dummy text in the paragraph:
Current when using the HierarchicalDataSource you can only load one level of data at a time. I would like to be able to pre-populate the entire tree (but have the ability to refresh it via remote data, should I so need).
@Html.DevExpress().ComboBox(
    settings => {
        settings.Name = "comboBox4";
        settings.Width = 180;
        settings.SelectedIndex = 0;
        settings.Properties.DropDownWidth = 550;
        settings.Properties.DropDownStyle = DropDownStyle.DropDownList;
        settings.CallbackRouteValues = new { Controller = "Editors", Action = "MultiColumnComboBoxPartial" };
        settings.Properties.CallbackPageSize = 30;
        settings.Properties.IncrementalFilteringMode = IncrementalFilteringMode.StartsWith;
        settings.Properties.TextFormatString = "{0}";
        settings.Properties.ValueField = "CustomerID";
        settings.Properties.ValueType = typeof(string);

        settings.Properties.Columns.Add("ContactName", "ContactName", 130);
        settings.Properties.Columns.Add("CompanyName", "CompanyName", Unit.Percentage(100));
        settings.Properties.Columns.Add("Country", "Country", 60);
        settings.Properties.Columns.Add("Phone", "Phone", 100);
    }
).BindList(ViewData["Customers"]).GetHtml()
We need the bar of series to be draggable and also its value can be changed on drag.
For example, a user is given a chart like below link:
http://demos.kendoui.com/dataviz/bar-charts/column.html.
Below the chart, a table is given for data. Chart is loaded with false data. User is expected to plot the correct graph based on the table data given. For this, user will drag the bar in up/down direction to set it to the desired value.
It would be nice to have onClick callback as a part of drawing props in spreadsheet.
Scenario:
When I have more than one image on a spreadsheet, on click of those images I want to get info about the image more specifically range of the topLeft cell the image is attached to.
I have explained a lil bit more here, and I also have a work around here for now but if we have onClick call back it will give us bit more control over the images in spreadsheet.
It would be nice that export-to-excell feature supports the text orientation which is supported by MS Office and Open Office. This feature lets the user to have vertical text in the worksheet.
It would be beneficial to add additional support for tooltips natively on the Bubble Layer in RadMap
Merge ListView and MobileListView implementations to have a single ListView with support for Grouping, PullRefresh, Infinite Scrolling etc.

For ex. Using a MobileListView with a single item per row on an ipad pro is a waste of space. But there is no support for applying grids ( purecss or bootstrap ) to the mobile listview. This is possible with the web listview but then you lose features like grouping, infinite scrolling, load more, etc.

Hence please make a single SuperListView with wider functionality support.
It would be nice to have navigation methods like 'nextRecord', 'previousRecord' to select grid records. These methods must take care of paging issues and load next/previous page automatically and select the correct record afterwards. I've implemented these methods on my side nut it would be easier to have them natively as part of the grid implementation.
Provide or change the current default value of Aggregation from 'Max' to 'None', so that user can select his desired aggregation from UI.