Create a grid with batch set to true and update a field value using the set method of the kendo.data.Model object in JavaScript. The grid cell will be marked as dirty but the "Save changes" or "Cancel changes" buttons will not display. If you click into another editable cell, then the buttons will display.
See https://dojo.telerik.com/TwTMSsrB and attached example.html.zip.
See attached image.png for example image.
If you create a grid with editable set to true, selectable set to one of the multiple options ("multiple, row" or "multiple, cell"), batch set to true and a column with editing disabled (either through the model or through the columns editable property), then when you update an editable cell and click the non-editable cell in the same row the "Save changes" and "Cancel changes" buttons do not appear.
See https://dojo.telerik.com/zAKmmTEU and attached example.html.zip
Notes:
Editable is disabled using a JavaScript function for UnitsInStock
{ field: "UnitsInStock", title: "Units In Stock", width: 120, editable: function() { return false; } },Editable is set to false in the schema model for Discontinued
Discontinued: { type: "boolean", editable: false },
In this example, if you change the value of a UnitPrice cell and then click one of the non-editable cells (UnitsInStock or Discontinued) in the same row, the UnitPrice cell will be marked as dirty, but the "Save changes" and "Cancel changes" buttons will not appear.
This appears to happen because of the following:
- The focusout event is triggered on the grid.
- The closeCell method is called from the tap event registered on the cell.
- The _destroyEditable method is called within the closeCell method.
- The _editContainer field is set to null in the _destroyEditable method.
- The closeCell method is called again from within the editCell method but returns early because the _editContainer field is null.
- The timeout anonymous method from the focusout event handler is called, but the _toggleToolbarEditingItemsVisibility method is not called because _editContainer is null.
Stack trace:
n (kendo.all.min.js:9)_destroyEditable (kendo.all.min.js:9)
closeCell (kendo.all.min.js:9)
tap (kendo.all.min.js:9)
trigger (kendo.all.min.js:9)
_click (kendo.all.min.js:9)
i.<computed> (kendo.all.min.js:9)
dispatch (jquery.js:5430)
elemData.handle (jquery.js:5234)
See attached image.png for an example image.
Hi Team,
While I understand there are release notes and breaking changes, I would like to request you consider adding some version information to the documentation. This would help identify when certain features were introduced.
Thank you!
Bug report
When using the raw JavaScript files from the src\src\dist\raw-js folder (included directly via <script> tags), the Kendo UI version (kendo.version) always returns 0.0.0, and the package metadata in kendo.all.js has the version field hardcoded to 0.0.0.
Reproduction of the problem
1. Download Kendo UI for jQuery commercial distribution.
2. Use the files from the following path:
`src\src\dist\raw-js\`
3. Include kendo.all.js (and other scripts) directly in an HTML page using <script> tags.
4. Include a valid license key using:
`KendoLicensing.setScriptKey("your-license-key");`
5. Run the application and inspect the console.
Call: console.log(kendo.version);
Result: The version displayed is "0.0.0".
Current behavior
kendo.version returns "0.0.0".
_parsedPackageMetadata in kendo.all.js shows:
version: '0.0.0'
Expected/desired behavior
The PACKAGE_METADATA placeholder should be replaced during the build or distribution process, even in the raw-js folder outputs.
Environment
Kendo UI version: 2025.3.1002
Browser: [all ]
Please make the speech to text button/suffix of a kendo textarea available via mvvm. Also speech to text button to come standard as a tool in the kendo editor.
When I add a minimum or maximum value to the date picker, the control allows out-of-range dates to be entered until the dateInput option is set to true. At that point, any out-of-range date will be set to either "min" or "max." The change event will not be called for that change.
This would be perfect:
- The default behavior is to set the minimum or maximum value when the date input value is out of range. It would be nice if this behavior didn't depend on the dateInput option.T
- Trigger a change event when the control itself sets the minimum or maximum value.
- Add an option to change the behavior to generate an error on the control when an out-of-range value is entered.
Note: In some situations, the default behavior of setting it to "min" or "max" can also be useful... but with a change event trigger however!
We have noticed a serious performance issue in the TreeList control which I have confirmed in the latest version in this Dojo: https://dojo.telerik.com/aNuKanAG. This Dojo is a based on the TreeList in-cell editing demo from your website.
- Open the Dojo link I provided and Run it.
- Open your browser DevTools console so you can see console.log messages.
- Navigate to a leaf node of the tree if it isn't already open by default; ex: Daryl -> Guy -> Buffy -> Hyacinth
- Click in and out of an editable cell; ex: Ext
- Observe the DevTools console where you will see that the 'rendered XXX' text has been written for EVERY CELL in the entire tree.
- Expand/collapse the closest parent group
- Again, observe that EVERY CELL has been re-rendered
I was trying to figure out if there was any good reason for this. In the Dojo above all data are nested under a single parent. So, I created another Dojo but this time there are two separate parent groups: https://dojo.telerik.com/OcEmAgIz. This Dojo is based on the Binding to local data demo from your website.
- Open the Dojo link and Run it.
- Clear the DevTools console so you can see a clean display of results for the next action.
- Expand and collapse a child group of Daryl Sweeney.
- Observe the console log results: you will see that Dan Sweeney was also re-rendered.
The problem here is that these re-renders are very expensive. Imagine if the call to console.log was instead something else that might need a bit of computation time to complete.
The simple act of expanding and collapsing a group from an unrelated part of the tree, or simply opening and closing an editable cell should not result in the entire tree being re-rendered. This is a serious performance issue, and seems completely unnecessary.
What I have demonstrated in the Dojos I created is that Kendo is re-rendering the ENTIRE structure. The goal of this feature would be to rerender only the specific cells of the treelist that have been impacted by an edit.
Currently, the Kendo UI RangeSlider provides a single-colored track (.k-slider-track) with a separate style applied only to the selected range. However, in many modern design requirements, there is a need to split the track into multiple colored sections (e.g., 3 or more segments with different colors) to visually represent thresholds, ranges, or categories.
Example Use Cases:
Displaying low, medium, and high ranges with green, yellow, and red colors.
Visualizing different risk or performance levels directly on the slider track.
Providing a better UI experience by mapping ranges to business values.
Requested Feature:
Add native support to configure multiple color segments within the RangeSlider track (either via configuration options or styling hooks). Ideally, developers should be able to specify:
Number of segments.
Color for each segment.
Segment boundaries (percentage or value-based).
Workarounds Tried:
Custom CSS overlays and pseudo-elements can partially simulate the effect, but they are not reliable or fully aligned with the slider’s rendering behavior.
Impact:
This feature would enhance usability and visualization, making the RangeSlider more flexible for dashboards, financial apps, performance monitoring, and other business-critical UI scenarios.
Reference:
Please find an attached image illustrating the requested multicolored track (example with 3 segments: green, yellow, and red).
We have a column in our grid bound to a complex JSON object. When a different column's value is changed, we need to change the nested properties in the complex JSON object.
To do this, in the grid's Save event, we are calling model.set("theComplexObject.NestedProperty", newValue). However, doing this does not automatically update the UI for that row's cell. Furthermore, it never seems to mark the column dirty. Manually calling grid.refresh() will fix the issue, but the grid we are working on has a lot of columns and it adds a performance hit.
This approach works for all of our other columns that do NOT use complex objects. They correctly show the dirty flag and new model value after the save operation completes.
Below is a Dojo example with the save event wired up and a complex name column. It's worth mentioning that the dirty flag also doesn't appear to be working on the eye color column. This may be another bug introduced in a newer version of Kendo.
https://dojo.telerik.com/ZHkxwJee
- Change the age for a column and click off the cell. The eyeColor updates, but the name does not. The dirty flag gets put in the first cell for some reason (this happens when updating the second row too... it adds the dirty flag to the first cell in the first row).
- Enabling the currently commented line that does e.sender.refresh() will fix the display issues, but the dirty flag still doesn't show for the name column.
We would like the ability to execute custom actions once a control has been fully initialized and rendered.
Use Case
On our login page, we use the Form control. After the Form control is created, we need to reposition our SSO buttons so that they appear beneath the default buttons rendered by the form. Without a reliable event, it is difficult to determine when the control is ready for safe modification.
Proposed Solution
Introduce a Created event (or similar) that is triggered once the control is fully rendered. This event would provide a hook for developers to perform additional UI adjustments or integrate custom functionality.
Reference
Syncfusion ASP.NET Core controls provide this functionality through a Created event.
Bug report
Currenlty, styles/font-icons/index.css has this line at the bottom:
/*# sourceMappingURL=index.css.map */
But the map file is not part of the distribution files, so it's causing the browser to throw an additional request for the map file.
Currenlty, the index.css.map is present in the node_modules/@progress/kendo-font-icons/dist/index.css :

But is not part of the Kendo jQuery distribution.
Expected/desired behavior
The distribution should be revised and the map file should be copied.
Environment
- Kendo UI version: 2025.3.825
- Browser: [all ]
When a pager control uses responsive mode, but renders initially as hidden, the control fails to render properly.
The control should render to the appropriate responsive mode regardless of whether the control is visible or not when it is initially rendered.
Hi Team,
I would like to request the source code from the AI Service from the Kendo UI Grid demos be available to download.
Thank you!
Hello
Starting from version 2025.2.520:
Kendo Grid with NumericTextBox cell editor and "navigatable: true" exit edit cell state on double click/hold to select number inside editor.
Earlier versions did not have this issue.
Scenario:
Inside cell with NumericTextBox editor trying to select value without exit from edit cell state.
On click cell, that already in edit mode, switch to read mode (NumericTextBox disappears)
Desirable behavior:
Copy and paste to cell without exit and enter again in edit cell state.
Select all value without loosing editing cell state.
Dojo
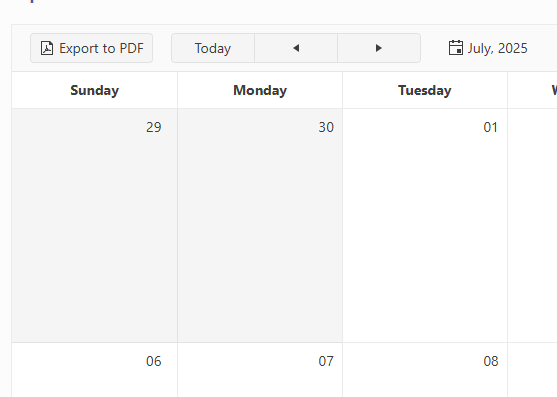
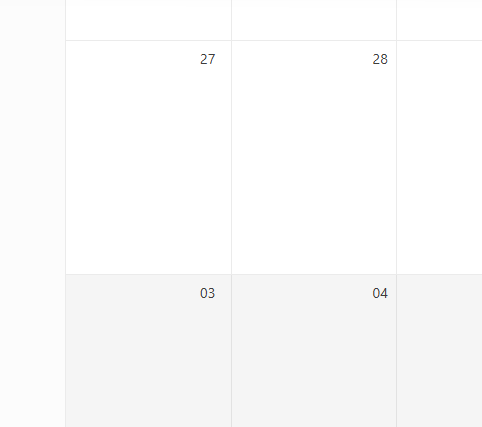
Views - Month - numberOfWeeks (set to 6 weeks), do not need to see previous or next month week. Only show days of the selected month.
This is OK:
This is not, unnecessary week of Aug 03. The extra week adds to a busy calendar clutter.
Bug Report
When building with NPM, the glob is mismatched. This is currently related to the source code build.
Reproduction
- Build with version 2025.2.702 in NPM.
Current behavior
Receiving the specific error message:
[!] SyntaxError: The requested module 'glob' does not provide an export named 'default'
Environment
- Kendo UI version: 2025.2.702
- jQuery version: All supported versions
- Browser: all
Bug report
When a user edits a cell/row and presses enter, the cell is marked as dirty. However, the Save and Cancel buttons remain disabled, thus the user should focus on a different cell before being able to save changes.
Reproduction of the problem
- Dojo - https://dojo.telerik.com/JuMumnqH
- Edit a cell and press 'Enter'
Current behavior
The cell is closed and marked as dirty, the 'Save changes and 'Cancel changes' buttons remain disabled.
Expected/desired behavior
The buttons should be enabled once the cell is marked as dirty.
Workaround
cellClose: function(e){
                e.sender._toggleToolbarEditingItemsVisibility()
},
Environment
- Kendo UI version: 2025.2.520
- Browser: [all ]
Hi team,
I think there is a bug in the dependency detection.
In the attached "config_buged.js" i have chosen some components. The component "chiplist" was partially checked due to dependency.
When lunching my application I got the error :
Message: e(...).kendoChipList is not a function
at init._createList (kendo.custom.min.js:91:8505)
at new init (kendo.custom.min.js:91:3218)
at init._attachGroupable (kendo.custom.min.js:133:96797)
at init._groupable (kendo.custom.min.js:133:96348)
at init._continueInit (kendo.custom.min.js:133:33864)
at new init (kendo.custom.min.js:133:33735)
at HTMLDivElement.<anonymous> (kendo.custom.min.js:1:42737)
at jQuery.each (jquery-3.1.1.js:368:19)
at jQuery.fn.init.each (jquery-3.1.1.js:157:17)
at e.fn.<computed> [as kendoGrid] (kendo.custom.min.js:1:42713)
I was forced to totaly check the "chipList" component as seen in the attached file config.json


