This is the code snippet for reproducing the error message:
        static void Main(string[] args)
        {
            string filePath = "Lorem ipsum dolor sit amet.pdf";
            //load a random document
            PdfFormatProvider provider = new PdfFormatProvider();
            RadFixedDocument originalDocument;
            using (Stream stream = File.OpenRead(filePath))
            {
                originalDocument = provider.Import(stream);
            }
            //draw something on the first page
            FixedContentEditor editor = new FixedContentEditor(originalDocument.Pages[0]);
            editor.GraphicProperties.IsFilled = true;
            editor.GraphicProperties.FillColor = RgbColors.Black;
            Telerik.Documents.Primitives.Rect Rect = new Telerik.Documents.Primitives.Rect(10, 10, 200, 100);
            editor.DrawRectangle(Rect);

            //export the pages as images and build a brand new document from the images
            SkiaImageFormatProvider imageProvider = new SkiaImageFormatProvider();
            imageProvider.ExportSettings.ImageFormat = SkiaImageFormat.Jpeg;
            imageProvider.ExportSettings.ScaleFactor = 0.8;
            imageProvider.ExportSettings.Quality = 80;


            RadFixedDocument doc = new RadFixedDocument();
            foreach (RadFixedPage page in originalDocument.Pages)
            {
                byte[] resultImage = imageProvider.Export(page);
                RadFixedPage pdfpage = doc.Pages.AddPage();
                editor = new FixedContentEditor(pdfpage);
                Stream imageStream = new MemoryStream(resultImage);
                editor.DrawImage(imageStream);
            }

            //export the pdf built from the images
            PdfFormatProvider pdfFormatProvider = new PdfFormatProvider();
            string outputPdf = @"output.pdf";
            File.Delete(outputPdf);
            using (Stream output = File.OpenWrite(outputPdf))
            {
                pdfFormatProvider.Export(doc, output);
            }
            Process.Start(new ProcessStartInfo() { FileName = outputPdf, UseShellExecute = true });
}Workaround:
        static void Main(string[] args)
        {
            string filePath = "Lorem ipsum dolor sit amet.pdf";
            //load a random document
            PdfFormatProvider provider = new PdfFormatProvider();
            RadFixedDocument originalDocument;
            using (Stream stream = File.OpenRead(filePath))
            {
                originalDocument = provider.Import(stream);
            }
            //draw something on the first page
            FixedContentEditor editor = new FixedContentEditor(originalDocument.Pages[0]);
            editor.GraphicProperties.IsFilled = true;
            editor.GraphicProperties.FillColor = RgbColors.Black;
            Telerik.Documents.Primitives.Rect Rect = new Telerik.Documents.Primitives.Rect(10, 10, 200, 100);
            editor.DrawRectangle(Rect);

            using (Stream output = File.OpenWrite(filePath))
            {
                provider.Export(originalDocument, output);
            }

            using (Stream stream = File.OpenRead(filePath))
            {
                originalDocument = provider.Import(stream);
            }
            //export the pages as images and build a brand new document from the images
            SkiaImageFormatProvider imageProvider = new SkiaImageFormatProvider();
            imageProvider.ExportSettings.ImageFormat = SkiaImageFormat.Jpeg;
            imageProvider.ExportSettings.ScaleFactor = 0.8;
            imageProvider.ExportSettings.Quality = 80;


            RadFixedDocument doc = new RadFixedDocument();
            foreach (RadFixedPage page in originalDocument.Pages)
            {
                byte[] resultImage = imageProvider.Export(page);
                RadFixedPage pdfpage = doc.Pages.AddPage();
                editor = new FixedContentEditor(pdfpage);
                Stream imageStream = new MemoryStream(resultImage);
                editor.DrawImage(imageStream);
            }

            //export the pdf built from the images
            PdfFormatProvider pdfFormatProvider = new PdfFormatProvider();
            string outputPdf = @"output.pdf";
            File.Delete(outputPdf);
            using (Stream output = File.OpenWrite(outputPdf))
            {
                pdfFormatProvider.Export(doc, output);
            }
            Process.Start(new ProcessStartInfo() { FileName = outputPdf, UseShellExecute = true });
        }
Hi Telerik,
Could you add abbility to contact TSA (timestamp) server and sign PDF document with certificate (which is currently supported) and signed timestamp?
Thank you
Error message:
System.InvalidCastException: 'Unable to cast object of type 'Telerik.Windows.Documents.Fixed.FormatProviders.Pdf.Model.Types.PdfHexString' to type 'Telerik.Windows.Documents.Fixed.FormatProviders.Pdf.Model.Types.PdfLiteralString'.'SkiaImageFormatProvider: Add support for Text, TextMarkup, Line, and Stamp annotations.
Currently, these annotations are omitted on image export.
When importing a document with button field with missing type, an error occurs.
51 0 obj
<< /Kids [ 70 0 R 71 0 R 72 0 R 73 0 R 74 0 R 75 0 R 76 0 R 77 0 R 78 0 R 79 0 R 80 0 R 81 0 R 82 0 R 83 0 R 84 0 R 85 0 R 86 0 R 87 0 R 88 0 R 89 0 R 90 0 R 91 0 R 92 0 R 93 0 R 94 0 R 95 0 R 96 0 R 97 0 R 98 0 R 99 0 R 100 0 R 101 0 R 102 0 R 103 0 R 104 0 R 105 0 R 106 0 R 107 0 R 108 0 R 109 0 R 110 0 R 111 0 R 112 0 R 113 0 R 114 0 R 115 0 R 116 0 R 14 0 R ] /T (Button 70) >>
endobj
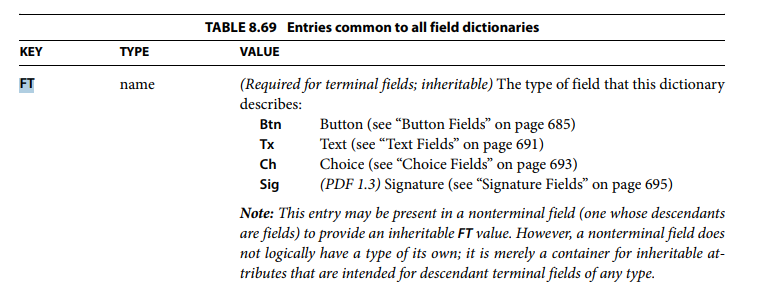
Workaround: Handle the exception: https://docs.telerik.com/devtools/document-processing/libraries/radpdfprocessing/features/handling-document-exceptions
When importing a document with an invalid creation or modification date, an exception is thrown:
- FormatException: 'The input string '' was not in a correct format.'
- ArgumentOutOfRangeException: 'Year, Month, and Day parameters describe an unrepresentable DateTime.'
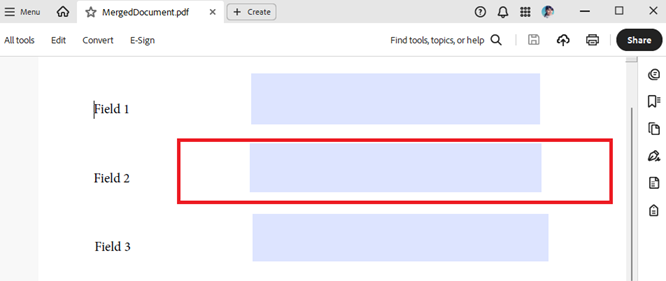
When a Pdf document contains TextBoxFields some of which are hidden and you merge it with another document, the hidden state is reset and the field appears in the merged document:
Before:
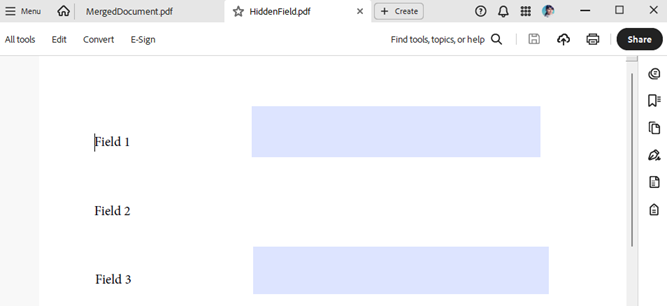
After:
Make Schema Properties Mutable
Implement Schema Serialization Methods
Extend XMP Writer for Serialization
Integrate XMP Writer with Document Export
When trying to create documents simultaneously from different threads (in concurrent scenario), different exceptions are thrown:

- NullReferenceException in Telerik.Windows.Documents.Core.Fonts.OpenType.OpenTypeFontSource.ReadTableData[T](UInt32 tag, ReadTableFormatDelegate`1 readTableDelegate) method,

- OverflowException in Telerik.Windows.Documents.Core.Fonts.OpenType.Tables.CMapFormat4Table.Read(OpenTypeFontReader reader) method.


Available in LIB version: 2017.2.814
This would allow to disallow some rows from splitting.
 This is content stream operator used for setting color in Device, CIE-based or Indexed color space.

Available in R2 2018 Official Release version.