Can the dev team comment on any known reasons why Charts (I think both SVG and Canvas) might not display when a blazor page is rendered from an automation tool like Chromium, Puppeteer, etc.? (e.g., https://developers.google.com/web/tools/puppeteer).
I have a standard blazor page that I can manually from a standard Chrome window, and it works fine and the Telerik chart displays.
But the same page, when launched either headless or with a GUI browser window, from a tool like Chromium or Puppeteer (with javascript enabled of course), it seems like the DOM is never dynamically updated to include the chart.
For real-time data purposes, I need to update the data and add new items. If I drill down and then add a new item, the Chart refreshes and goes to the top page (resets the drill down level to 0).
Reproduction: https://blazorrepl.telerik.com/QeOtQaOD46j4I3Ih46.
I want to be able to dynamically enable/disable the Pan and Zoom functionalities at runtime. Currently, the Chart does not react to such changes.
===
ADMIN EDIT
===
A possible option for the time being is to dispose the component and re-initialize it after changing the Pan/Zoom properties: https://blazorrepl.telerik.com/mSuNQkEj10nSug2k22.
Hi, I can't figure how to use the Min/Max properties of the ChartCategoryAxis because if I set these properties, the chart disappears.
Please help me.
@page "/"

<TelerikChart>

    <ChartSeriesItems>
        <ChartSeries Type="ChartSeriesType.Line" Name="Test" Data="@mesures"
                     Field="@nameof(Mesure.Value)" CategoryField="@nameof(Mesure.Date)" Aggregate="ChartSeriesAggregate.Sum">
        </ChartSeries>
    </ChartSeriesItems>

    <ChartCategoryAxes>
        <!-- This is OK -->
        @*<ChartCategoryAxis BaseUnit="ChartCategoryAxisBaseUnit.Hours" Type="ChartCategoryAxisType.Date" BaseUnitStep="1"></ChartCategoryAxis>*@

        <!-- This isn't : nothing is displayed -->
        <ChartCategoryAxis Min="@MinDate" Max="@MaxDate" BaseUnit="ChartCategoryAxisBaseUnit.Hours" Type="ChartCategoryAxisType.Date" BaseUnitStep="1"></ChartCategoryAxis>
    </ChartCategoryAxes>

</TelerikChart>

@code {

    private DateTime MinDate { get; set; } = new DateTime(2019, 01, 01, 13, 0, 0);
    private DateTime MaxDate { get; set; }   = new DateTime(2019, 01, 01, 17, 0, 0);

    public class Mesure
    {
        public DateTime Date { get; set; }
        public int Value { get; set; }
    }

    public List<Mesure> mesures = new List<Mesure>()
    {
        new Mesure() { Date = new DateTime(2019, 01, 01, 13, 0, 0), Value = 1 },
        new Mesure() { Date = new DateTime(2019, 01, 01, 14, 0, 0), Value = 2 },
        new Mesure() { Date = new DateTime(2019, 01, 01, 14, 30, 0), Value = 3 },
        new Mesure() { Date = new DateTime(2019, 01, 01, 14, 35, 0), Value = 4 },
        new Mesure() { Date = new DateTime(2019, 01, 01, 15, 0, 0), Value = 5 },
        new Mesure() { Date = new DateTime(2019, 01, 01, 16, 0, 0), Value = 6 },
        new Mesure() { Date = new DateTime(2019, 01, 01, 17, 0, 0), Value = 7 },
    };
}It would be nice to be able to use Html markup in the ChartCategoryAxisLabel.
I can see in the documentation that it currently doesn't support this. I am curious if it is possible. Thank you.
This functionality would be very useful for data analysis.
Moving the cursors within the chart itself, allows to define a range within the series, being able to offer useful data.
Examples:
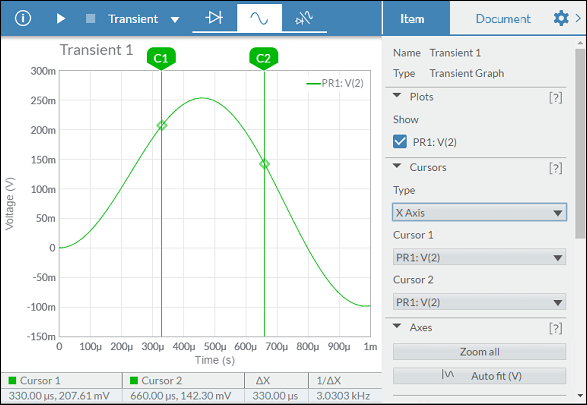
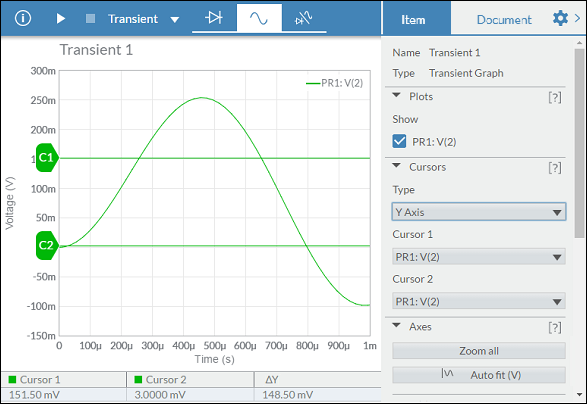
I would like to synchronize several Charts, so when I move the mouse through one of them, the other two Charts show crosshairs at the same position as the first hovered Chart.
===
ADMIN EDIT
===
Prerequisite: Chart Crosshair
Hi,
I would like to be able to show / hide a serie by clicking to a legend.
Is there a way to do it actually ?
Hello,
Please consider a built-in way to add spacing (gaps, margins, etc.) between the segments of a Donut and Pie charts. The <ChartSeries> tag has such parameters, but they are used for other settings or other series types.
Currently, it is possible to achieve the desired appearance with custom CSS, but that requires knowledge about the Chart rendering.
I would like to be able to stack series on a range chart. Currently the best hack recommended by Telerik is to show two charts on top of one another, with no interactivity or legends, https://blazorrepl.telerik.com/wHPclTFm28WuoSOp57.
Source: Is it possible to 'stack' series in a Range Column Chart? in UI for Blazor | Telerik Forums
Thank you
Hello,
I want to connector to be directly connected with the chart.
See https://dojo.telerik.com/AkEHuSiq/3 for reference.
Thank you.
I want horizontal and vertical lines in the chart to act as markers (limits, thresholds). It would be awesome if there was a way to simply draw a horizontal and vertical lines, bound to a collection of y and x data respectively.
Something like the below would be nice
<TelerikChart>
<ChartSeriesItems>
<ChartSeries Type="@ChartSeriesType.Line" Name="@P_Name1" Color="blue"
Data="@P_Data1"
Field="@P_Field1"
CategoryField="@P_CategoryField1">
<ChartSeriesLabels Visible="true" Template="#=dataItem.P_Description#" />
<ChartSeriesMarkers Size="4" />
</ChartSeries>
<ChartHorizontalLines Data="@YLinesData"/>
<ChartVerticalLines Data="@XLinesData"/>
</ChartSeriesItems>
</TelerikChart>
@code{
List<double> YLinesData, XLinesData;
}
---
ADMIN EDIT
You can find some more details and ideas for workarounds here to consider in the meantime.
---