Unplanned
Last Updated: 13 Feb 2023 12:26 by Heiko
Created by: Heiko
Comments: 0
Category: Charts
Type: Feature Request
1
I would like to be able to set default global options per series type with the SeriesDefault configuration. 
Unplanned
Last Updated: 22 Dec 2022 14:26 by Tanner
Created by: Tanner
Comments: 0
Category: Charts
Type: Feature Request
2
I want to be able to set a border-radius to the plot area to round the edges. 
Unplanned
Last Updated: 04 Nov 2022 17:25 by Christopher
Created by: Christopher
Comments: 0
Category: Charts
Type: Feature Request
3
Please add Funnel chart type such as the one available in Kendo.
Unplanned
Last Updated: 04 Nov 2022 17:29 by ADMIN
Created by: Christopher
Comments: 2
Category: Charts
Type: Feature Request
8
This is a feature request....please add box and whisker plot & sankey charts to your blazor and/or asp.net core chart controls.
Unplanned
Last Updated: 20 Jun 2024 09:16 by ADMIN
I would like to customize the appearance of the Chart markers. For example, in a Scatter Chart, I want to set different markers than the ones supported in the ChartSeriesMarkersType enum.
Unplanned
Last Updated: 08 Sep 2023 12:45 by Mark
Created by: Nikolas
Comments: 1
Category: Charts
Type: Feature Request
8

Hello,

Please allow us to distinguish which mouse button triggered the SeriesClick event.

Unplanned
Last Updated: 11 Jan 2024 14:30 by ADMIN
Created by: Alexander
Comments: 11
Category: Charts
Type: Feature Request
13
I'm looking for a way to change the hover colors of the chart. Please allow customization of the highlighted series item.
Unplanned
Last Updated: 04 Dec 2023 09:41 by Mark
Created by: Benjamin
Comments: 1
Category: Charts
Type: Feature Request
6
I would like to reverse the labels on the Value Axis
Unplanned
Last Updated: 03 Jan 2022 14:55 by ADMIN
Created by: Andrew
Comments: 1
Category: Charts
Type: Feature Request
1
The current version of the tooltip template context contains the information for the series color, but a particular data point might have a different color. Exposing such an option will allow better customization of the tooltip.
Unplanned
Last Updated: 08 Dec 2021 10:12 by ADMIN
Cannot remove the last series of a dynamically created chart
Unplanned
Last Updated: 22 Nov 2022 12:13 by ADMIN
Created by: Jesper
Comments: 4
Category: Charts
Type: Feature Request
12
I would like to customize the appearance of the Chart Legend
Unplanned
Last Updated: 06 Oct 2021 19:09 by ADMIN
Created by: Nikolas
Comments: 0
Category: Charts
Type: Feature Request
2

I would like a polar area chart.

Instead of

I want to have circular lines:

Unplanned
Last Updated: 05 Oct 2021 11:23 by ADMIN
The Chart does not render correctly when Stack100 is applied to the Series and it has only one value per series. When the value for the first series is greater than the value for the second series the rendering does not start from 0% to 100%, but from a percentage above 0%.
Unplanned
Last Updated: 07 Jan 2022 21:18 by Edward
Created by: Emil
Comments: 1
Category: Charts
Type: Feature Request
5
I would like to control the font of the value axis labels.
Unplanned
Last Updated: 25 Aug 2021 12:45 by ADMIN
I have 4 Radial Gauges and when I try to create a pdf with Kendo Drawing I am getting the following error: 

jQuery.Deferred exception: Cannot read property 'bbox' of undefined TypeError: Cannot read property 'bbox' of undefined.
Unplanned
Last Updated: 24 Aug 2021 14:59 by ADMIN
Created by: Kyle
Comments: 0
Category: Charts
Type: Feature Request
2
Expose Panes Functionality from the Chart Engine
Unplanned
Last Updated: 17 Oct 2023 15:35 by Mark
Created by: Lee
Comments: 1
Category: Charts
Type: Feature Request
16
Are there border settings in the Chart?
Unplanned
Last Updated: 10 Feb 2022 17:38 by ADMIN

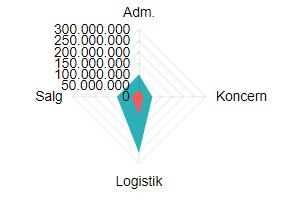
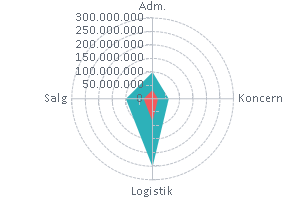
Is it possible to change plot area background color on charts so that every second line is a different color.

I have attached a image with the background color look.

---

ADMIN EDIT

The current request targets the ability to color the whole plot area in alternating way. If you need to only color a certain range of the plot area, you may take a look at the Plot bands feature request.

While the most common use case is to alter the background color based on the major plot area units, we'd like to gather your feedback on how you'd expect the feature to behave - allow color altering on major units, minor units or custom steps.

---

Unplanned
Last Updated: 27 Mar 2022 09:05 by Andrew

---

ADMIN EDIT

Screen recording attached below, code to reproduce  it too.

---

Unplanned
Last Updated: 01 Mar 2021 15:55 by ADMIN
When I set the AutoHide parameter of the Chart Tooltip to false it does not affect the way the tooltip is closing.