

The bug has two requirements for occurring:
- The system locale(culture) must use a comma as the decimal separator
- The report must contain at least one item, which takes the full available width of the report sections. Or an item may be docked to a section, which results in the same width as that of the section.
When those two conditions are met, the report will fail to render, and an error message stating that one of the numeric values in the report cannot be parsed. For example, the message may look like this:
One or more errors occurred. (The numeric portion of 170.01mm cannot be parsed as a unit of type Mm.)
To avoid the issue, slightly decrease the width of the item so that it does not occupy the full width of the report section. If Docking is used, disable it, or wrap the docked item in a smaller container.
Alternatively, a culture with a dot-based decimal separator may be used.
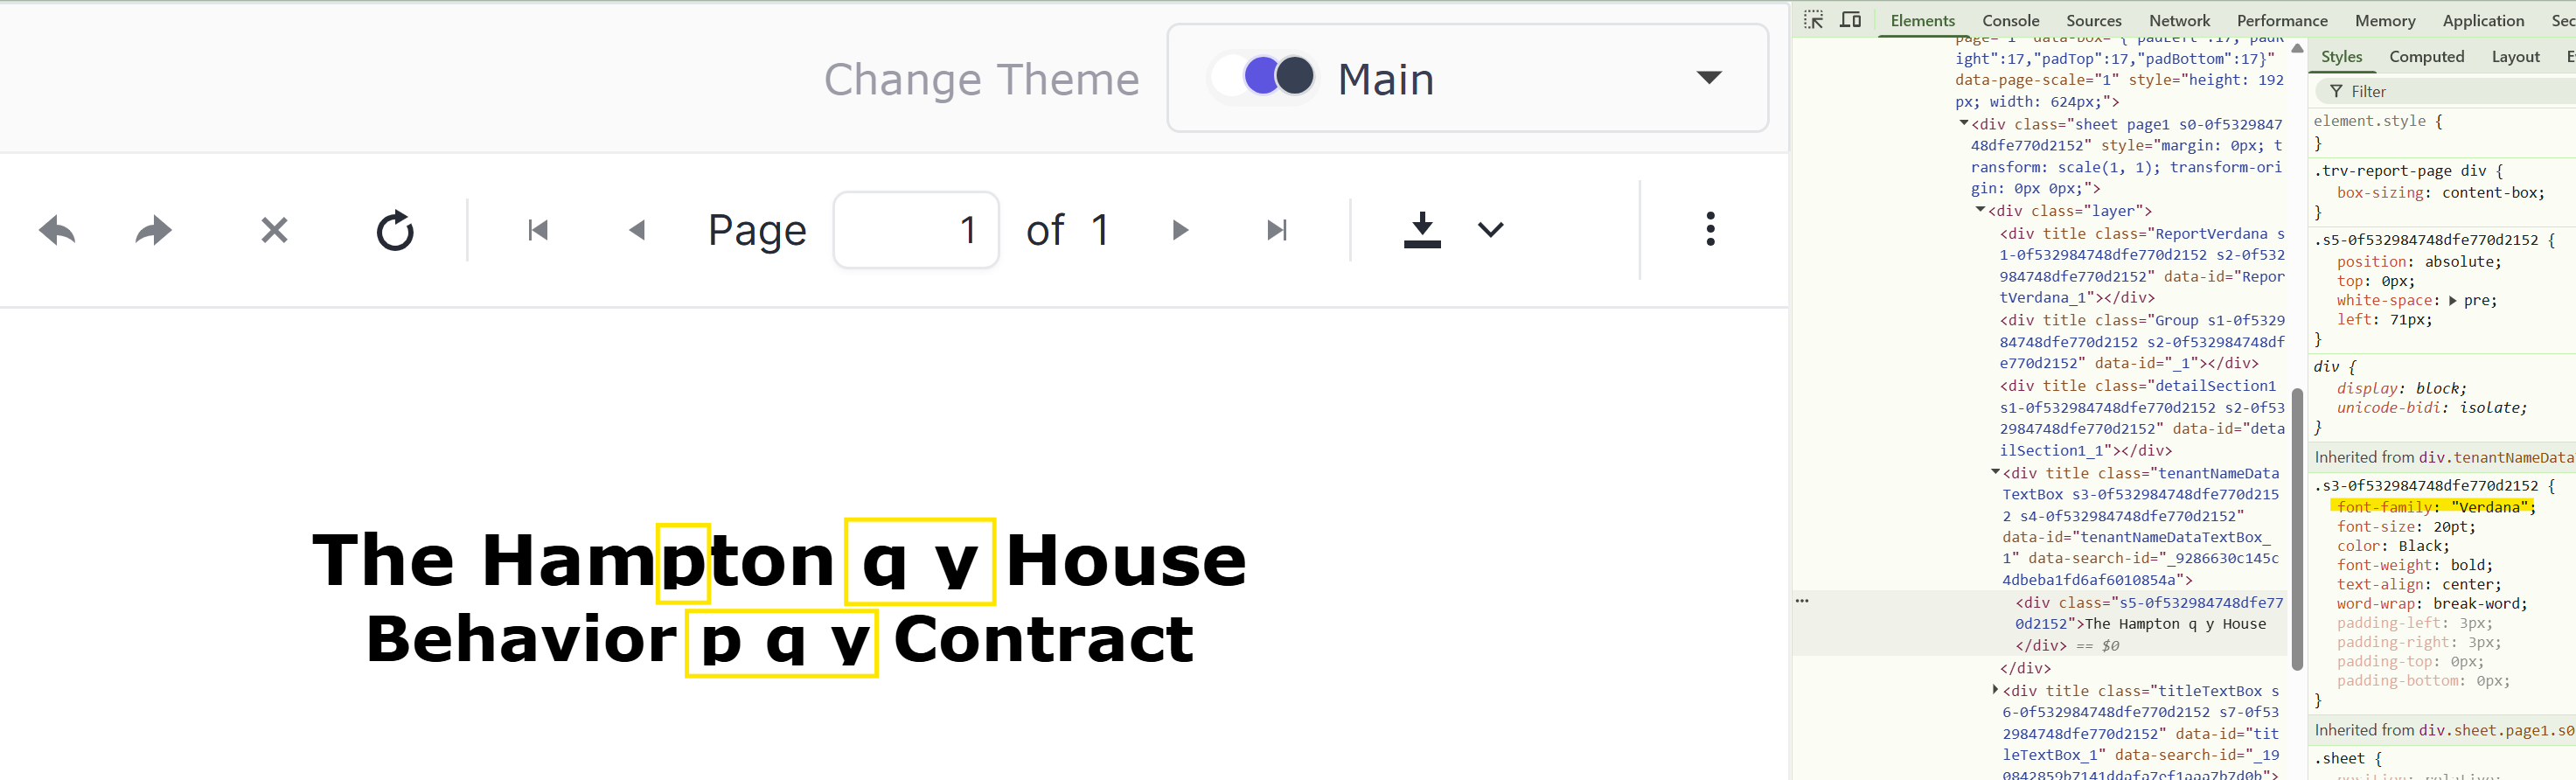
I use the Verdana font in my report titles. In the desktop designer and PDF documents, the text appears as expected.
In HTML5 and Blazor Report Viewers, though, the characters like 'p', 'q ', and 'y' appear cut off:
I use Zoom in my report definitions, which I edit with the Standalone Report Designers. The TRDP and TRDX reports work fine with Zoom. However, if I save a report with a non-default Zoom (e.g., 4.0) to the new TRDJ format, then I cannot open this report in the designer.
Here is the exception when trying to open the TRDJ report:
System.ArgumentException: Object of type 'System.Double' cannot be converted to type 'System.Single'.
   at System.ComponentModel.ReflectPropertyDescriptor.SetValue(Object component, Object value)
   at Telerik.Reporting.Serialization.ObjectReader.ReadValue(Object obj, PropertyDescriptor prop)
   at Telerik.Reporting.Serialization.ObjectReader.ReadAttributes(Object obj, PropertyDescriptorCollection props)
   at Telerik.Reporting.Serialization.ObjectReader.ReadProperties(Object obj)
   at Telerik.Reporting.Serialization.ObjectReader.ReadObject(Type type)
   at Telerik.Reporting.Serialization.ObjectReader.ReadXmlElement(String name)
   at Telerik.Reporting.JsonSerialization.JsonSerializer.Deserialize(String value, IResourceHandler resourceHandler)
   at Telerik.ReportDesigner.Packages.ReportDesigner.Serialization.JsonDocDataHandler.<>c__DisplayClass8_0.<DeserializeReport>b__0()
   at Telerik.Reporting.Interfaces.IAnalyticsExtensions.UseFeature[T](IAnalytics analytics, Func`1 func, String featureName, String featureCategory, Field[] extraParams)
   at Telerik.ReportDesigner.Packages.ReportDesigner.Serialization.JsonDocDataHandler.DeserializeReport(IDesignerLoaderHost targetHost)
   at Telerik.ReportDesigner.Packages.ReportDesigner.Serialization.ReportDocumentDesignerLoader.PerformLoad(IDesignerSerializationManager serializationManager)

Hello,
it seems there is some glitch in blazor telerik web report designer. So its not possible, to use stored procedure with parameters as datasource
lets have input parmeter in SP, expecting "some value", how to configure it for report? Only person, which is designin report, puts the value in as constant.
@Typ=1
1) - web report designer doesnt remember sql connection type(Choose data connection): Shared vs EMBEDED. Always fall to shared, when reopening report(but was configured as embeded).
2) - web repor designer, not applying DEFAULT "Configure design time parameters" VALUES, and also "Configure data source parameters". They are correctly stored in TRDP, they are visible in sql wizzard steps, but ALWAYS passed as NULL to the datasource when OPENING report.
= so report is than messed up/or datasource invalid.
**NOT BUG, ENHANCEMET: 3) - allow filtering in SQL datasource wizard "Stored procedure". Normally there is hundred of SP and its pain to pick one. OR allow to write SP directly
4) - when using SQL datasource, its not getting filed values correctly, this command is executed:
exec sp_executesql N' SET FMTONLY OFF; SET FMTONLY ON;exec [dbo].[IMS_PRINT_GETSET] @Typ,@ID;',N'@Typ nvarchar(1),@ID int',@Typ=N'1',@ID=30
in sql wizzard, there is command: "exec [dbo].[IMS_PRINT_GETSET] @Typ,@ID;"
how to solve that?
You are not ALWAYS allowed to modify SP. just consume as DATASOURCE, so its NOT VALID.
IF 1=0 BEGIN
SET FMTONLY OFF
END
iam unable to use version 1007-its not compatibile in project with telerik.blazor 15.1 (conflict in some skia or document proccesing nugets), but its not the case.
example:
Video demonstrating(reopened existing report), all described points + profiler result.
telerik sends - WRONG:
exec sp_executesql N' SET FMTONLY OFF; SET FMTONLY ON;exec [dbo].[IMS_PRINT_GETSET] @Typ,@ID;',N'@Typ nvarchar(4000),@ID int',@Typ=NULL,@ID=NULL
telerik SHOULD send:
exec sp_executesql N' SET FMTONLY OFF; SET FMTONLY ON;exec [dbo].[IMS_PRINT_GETSET] @Typ,@ID;',N'@Typ nvarchar(4000),@ID int',@Typ=N'1',@ID=30
TSQL demo procedure(one procedure for multiple sources - real world usage):
create PROCEDURE [dbo].[IMS_PRINT_GETSET]
@Typ INT,@ID INT
AS
BEGIN
SET NOCOUNT ON;
--!!TELERIK BUGFIX, but you are NOT ALWAYS permited to modify SP!!:
IF 1=0 BEGIN
SET FMTONLY OFF
END
IF @Typ=2 BEGIN
SELECT TOP 500 * FROM vTabOrders_active
RETURN
END
IF @Typ=1 BEGIN
SELECT TOP 500 ID,CisloZakazky,Nazev,Poradi FROM TabXYZ
RETURN
END
END
Thanks, even for some hotfix ideas.
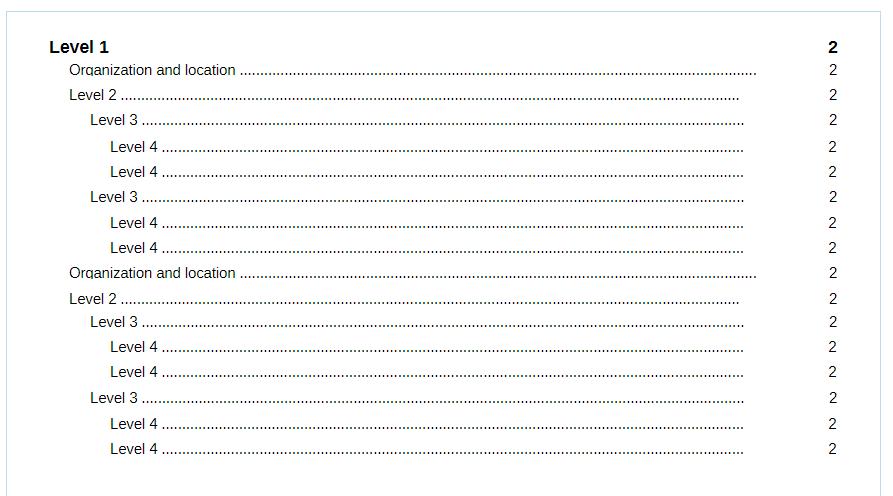
The following screenshot demonstrates what the ToC looks like when rendered with Skia on Linux.
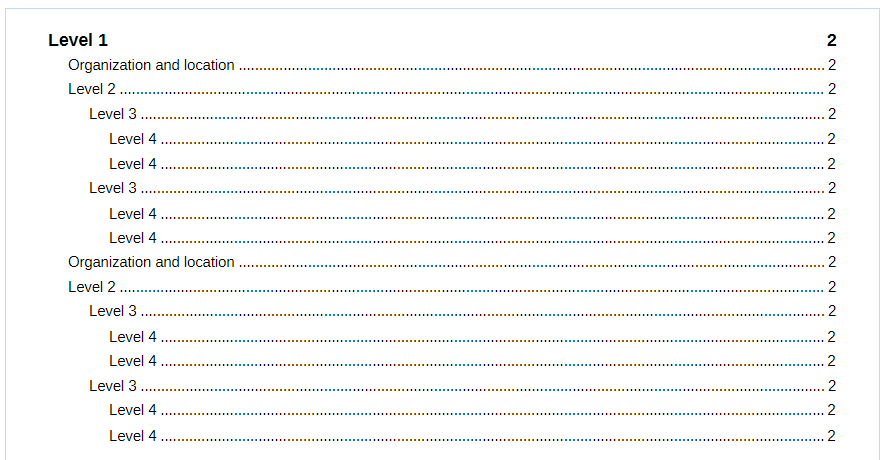
Below is the expected result. Rendered with GDI on Windows.
If I create an SqlDataSource component through the wizard, and select the option to embed the connection in the report, and later open the SqlDataSource wizard for that component again, the wizard does not remember that the selected data option was "Embedded" and again defaults to a shared connection.
The wizard should remember the chosen option for the SqlDataSource component.
Our production users rely on Excel for downstream analysis (formulas, filtering, sorting, pivoting, and ad hoc insights).
Current Telerik Excel export is layout-first (pixel-perfect), which preserves visual report structure but introduces merged cells, blank spacing rows/columns, decorative styling, and images.
For large datasets, this causes:
significant post-processing overhead,
slower export pipelines,
less usable spreadsheets for analytical workflows.
Business Impact
High-volume production exports with large row counts.
Users need data-centric Excel files, not print-layout replicas.
We use the same .trdp for PDF and Excel:
PDF requires full visual fidelity.
Excel requires clean, tabular, analysis-ready output.
Lack of built-in data-only mode forces custom cleanup logic, increasing maintenance risk and runtime cost.
Requested Feature
Add a built-in Excel Data-Only export mode (similar to Crystal Reports behavior), optimized for analytics and scale.
Proposed behavior (Data-Only mode)
Export as a flat tabular dataset (header + detail rows).
Preserve native data types (date/number/boolean) and formulas where applicable.
Avoid layout artifacts:
no merged cells (unless explicitly requested),
no decorative blank rows/columns from visual layout,
optional suppression of images/shapes/charts.
Optional minimal formatting only:
keep number/date formats,
remove decorative styles/fills/borders by default.
Optional toggles:
include/exclude report header/footer rows,
include/exclude groups/subtotals,
include/exclude hidden/report-only visual items.
Keep worksheet gridlines visible by default in data-only mode.
Optimize for large datasets (streaming-friendly, reduced memory overhead).
Suggested API / Configuration (example)
DeviceInfo or rendering setting, e.g.:
ExcelMode=DataOnly (default remains Layout)
IncludeImages=false
IncludeDecorativeFormatting=false
PreserveDataTypes=true
PreserveNumberFormats=true
FlattenGroups=true
Why this matters
This feature would allow teams to:
use one .trdp for both PDF (visual) and Excel (data),
eliminate expensive post-processing,
improve performance and reliability at production scale,
deliver spreadsheets that are immediately usable for business analysis.
Current Workaround
We currently perform custom post-processing to rebuild a clean workbook from rendered output (strip layout effects, remove visual artifacts, compact rows/columns).
This is complex, expensive, and fragile compared to a native renderer capability.
Request
Please consider adding this feature to the Telerik Reporting roadmap, or provide an officially supported pattern to achieve equivalent data-only output for Excel at scale.
I am using the Standalone Report Designer for .NET to open a code-based report from an application that was migrated from .NET Framework. Before the migration, function calls defined in the designer.cs file were preserved and evaluated at runtime as expected. However, after migrating to the code-based reports functionality supported by the Standalone Report Designer for .NET, these function calls are evaluated immediately during the report import process, and the resulting values are then serialized and stored in the report definition.
It would be nice if the function calls were preserved in the imported report, allowing them to be evaluated later at runtime, as their return values may change depending on the execution context.

The issue is caused by an issue in the SQL DataSource Wizard that doesn't provide the correct Data Provider name. In the wizard on the first page, the Data Provider must be MySql.Data.MySqlClient, but the option is limited only to MySql.Data. Since the engine cannot determine the type of the data provider by that name, it falls back to System.Data.SqlClient and claims that "Port" is not a supported keyword.
The workaround is to avoid using the SQL DataSource wizard and edit the data source properties directly in the properties grid. You can check the attached silent video that demonstrates how to do so.
Our Reportviewer is opened or displayed within a dialog, if i open the search the search dialog is moved to the far right side and is not visible directly.
We need to scroll to the search dialog to see it.
At the moment it's only possible to have your reports in old-fashioned projects.
It should be possible to add/design reports to SDK-style projects. That should work no matter what target framework is (.NET Core, .NET Standard or .NET Framework).

After upgrading Telerik.ReportViewer.BlazorNative to version 20.2.26.1007, rebuilding a project targeting .NET 9 or later fails with the following error:
Severity Code Description Project File Line Suppression State
Error (active) The asset 'C:\...\BlazorApp1\Debug\net10.0\compressed\14jp1i84hx-{0}-2x8nbomfaf-2x8nbomfaf.gz' can not be found at any of the searched locations 'C:\Users\<user>\.nuget\packages\telerik.reportviewer.blazornative\20.2.26.1007\staticwebassets\css\reporting-blazor-viewer.css.map' and 'C:\Users\<user>\.nuget\packages\telerik.reportviewer.blazornative\20.2.26.1007\staticwebassets\css\reporting-blazor-viewer.css.map'. BlazorApp1 C:\Program Files\dotnet\sdk\10.0.301\Sdks\Microsoft.NET.Sdk.StaticWebAssets\targets\Microsoft.NET.Sdk.StaticWebAssets.Compression.targets 276
-----------------------------------------------------------------------------------
The issue occurs because the NuGet package declares a CSS source map as a static web asset but does not include the corresponding file.
For the available workarounds, refer to the following Knowledge Base article: Missing CSS source map causes build failure in .NET 9 and later with Telerik.ReportViewer.BlazorNative 20.2.26.1007
This occurs most often with the first and last pages of the report. It seems that it might be an issue of the report viewer not switching the focus on current page. If I left-click in the area of the report currently displayed, the focus changes, and that seems to be enough to cause the code to update the page number input as well.
I have been forcing my webservice data source into a workable solution for making GraphQL requests. Right now in order for us to use GraphQL, we have to build out the request manually with a string such as the following:
{"query: "query GetSomeResult($input: Int!) {result {id name}}",
"variables": "{"input": @parameter}"
}
While this is a normal way to hand craft a GraphQL request, the issue I have is that it shouldn't need to be that hard. Also I get no intellisense or suggestion in regards to the data returning. This means that when I try to bind data to a text box, I have to visually validate that the [=Fields....] is actually correct by looking at the GraphQL query and at the code base. I would love to see the ability to to just say have a set of standard api technologies we could implement from such as GraphQL queries, GRPc queries, or any other contract style request. I would expect that the data source logic would be smart enough to parse the query (at least for GQL) and be able to provide reccomendations.
Also a major issue we have had is in being able to pass that data source to subReports, or dealing with any nested objects such as a user.address.addressLine1 would not be able to be found if address is a nested values like the following
user: {
  address: {
    addressLine1
  }
}
The Telerik Reporting REST Service storage is automatically cleaned based on some configurable timeouts and hardcoded times. It requires an awaken service to be performed.
It would be very useful for the developer to be able to invoke manually the storage cleaning functionality either with code or through the service Web API.
All of my report parameters have their AutoRefresh setting set to False, and the parameters do not depend on each other, they are not cascading parameters. The parameters have available values.
If I change the value of one of the parameters, despite the above settings, all of the other parameters' data is re-retrieved(even if those parameters are not visible).
This causes issues because the "Preview" button is disabled until the parameters are refreshed, and makes the UX bad since if the connection is slow, the end-users will have to wait for the parameters area to refresh after changing any parameter value.
I'm using VS 2022, the demo reporting (Telerik_Reporting_2026_Q1_20_0_26_211). When using the "Telerik Report 2026 Q1 Wizard", I select the following
- "Table Wizard"
- Current Data Sources
- Add New Data Sources
- Select "Object Data Sources
- I select my Assembly and data object.
- I select the Data source Member
See attach file when I finish the wizard.