In some cases the CartesianGridLineAnnotation can be offset with a single pixel from the expected position on the axis. For example, if the annotation is positioned at value 0 and there is a tick, a offset between the tick and the annotation can be observed.
To work this around, you can manually offset the annotation by setting its Top Margin.
<telerik:CartesianGridLineAnnotation Margin="0 1 0 0"/>
The trackball visuals are the ellipses that snap to the data points when you enable the trackball behavior and hover the plot area. If a trackball is displayed and you zoom-in (via mouse wheel) or pan (via drag), the trackball visuals stay on the proper data point as expected. However, if the zoom-in forces the corresponding data point to go outside the viewport, the trackball follows it and it doesn't get hidden (because it is outside the viewport/plot area).
To work this around, you can manually hide the Ellipse visuals.
private void RadChart_PanOffsetChanged(object sender, Telerik.Windows.Controls.ChartView.ChartPanOffsetChangedEventArgs e)
{
	Dispatcher.BeginInvoke(new Action(() =>
	{
		var chart = (RadCartesianChart)sender;
		var trackballs = chart.ChildrenOfType<Ellipse>().Where(x => x.DataContext is DataPointInfo);
		foreach (Ellipse visual in trackballs)
		{
			var dpInfo = (DataPointInfo)visual.DataContext;
			RadRect dpSlot = dpInfo.DataPoint.LayoutSlot;
			if (!chart.PlotAreaClip.Contains(dpSlot.X, dpSlot.Y))
			{
				visual.Opacity = 0;
			}
			else
			{
				if (visual.Opacity == 0)
				{
					visual.Opacity = 1;
				}
			}
		}
	}));
}
NullReferenceException when MinorTicksPerMajor of the axis is set and the chart gets unloaded.
To work this around, avoid setting the MinorTIcksPerMajor property in this scenario.
The exception can be observed when you a plot data point with value that falls outside of the range of the Decimal type.

As a workaround you can coerce the data before give it to the chart.
The FadeOtherSeries hover mode doesn't work when the lightweight render options (Direct2D and Bitmap) are used.
You can find one way to work this around in the attached project.
ArgumentException occurs when the ItemsSource of the chart series is populated with items that implement the ICustomTypeProvider interface and the value binding properties of the series (ValueBinding, CategoryBinding, YValueBinding, XValueBinding, etc.) are assigned to dynamic properties. This happens when the value binding properties are assigned to PropertyNameDataPointBinding object pointing to a property name. This is also what happens if you set the properties in XAML using string values.
To work this around, you can use the GenericDataPointBinding<T> class defined in code-behind in order to assign the value binding properties.
Or alternatively, you can implement custom PropertyNameDataPointBinding class and override its GetValue() method. In the method, you can check the item type and if it is ICustomTypeProvider, and then execute custom code that gets the value. The custom PropertyNameDataPointBinding implementation is shown in the attached CustomPropertyNameDataPointBinding.zip file. To use the custom binding class in XAML, you can use the following syntax:
<telerik:ScatterPointSeries.YValueBinding>
	<local:CustomPropertyNameDataPointBinding PropertyName="Y" />
</telerik:ScatterPointSeries.YValueBinding>
The SeriesCreated event of the RadChartView's SeriesProvicer is never called when the SeriesDescriptorSelector property is used.
To work this around, you can create a custom chart series descriptor and override its CreateInstanceCore method.
public class CustomScatterSeriesDescriptor : ScatterSeriesDescriptor
{
	protected override ChartSeries CreateInstanceCore(object context)
	{
		var series = (ScatterSeries)base.CreateInstanceCore(context);
		// assign whatever settings you need here
		return series;
	}
}
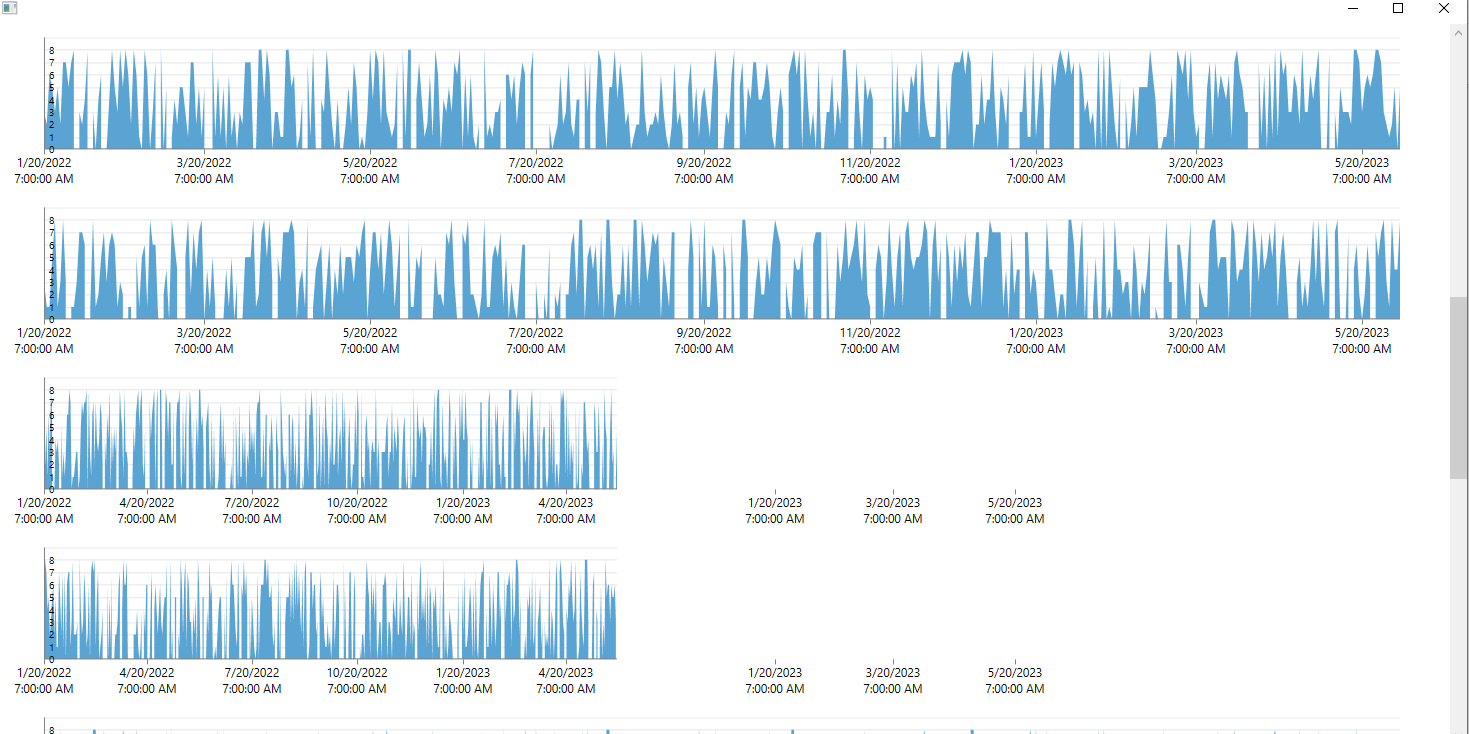
The problem arises when we have many graphs on one window and when we scroll to the bottom then to the middle of the window and then resize the width of the window, not all graphics dynamically resize, some harden to the previous size.
I am attaching a project in which you can reproduce the problem.
And I am attaching a video where the problem is clearly demonstrated.
Please solve the problem as soon as possible for our product it is critical!
LabelRotationAngle applies to labels only in horizontal axis.
It is mainly needed in Vertical axis, when the chart is rotated externally, when placed in rotated panel or control. In this case the vertical axis take the role of a horizontal axis visually and easy way to rotate all labels is needed for readability.
When a chart have long labels on the X axis (like date and time) the zoom is not accurate on the horizontal extents with both mouse wheel and drag area.
The reason is probably that the screen coordinates of the selected area are not mapped correctly on the X axis. The mapping works fine for tooltip.
You can verify this behavior in the attached Solution. In the images you can see the selected area (01), that the zoomed area is a region with no points (02) and the actual position of the points.
Gaps appear between the bars in the stacks when the series are populated with negative and positive values. Check the attached picture.

If you have a scenario with mixed values (positive and negative) use RangeBarSeries instead of BarSeries.
Issue1) When no RenderTransformOrigin is set to ScaleAnimation, all slices should be scaled from the pie chart center point. Currently thiss is not true, to better reproduce it , set MaxScale > 1 and notice slices overlap each other at the end of the animation.
Issue2) When RenderTransformOrigin is set to , for example (0, 0), all slices should start animating from topleft corner of the chart. Currently only the first one is animated from top left and all others are animated from pie chart center.
An InvalidCastException is thrown in the Fill/Background property binding in the series' DefaultVisualStyle when the RenderOptions is set to Bitmap or Direct2D.
" Collection was modified; enumeration operation may not execute.'" - The exception is observed when the CLR exceptions are enabled from Visual Studio.
Edit:
The Ellapsed event handler of the Timer is executed in background thread but modifying chart data in a background thread is considered bad practice which is not supported by our component. This is the reason we are declining this bug report.
General solution is to schedule the data update to happen on the UI thread with Dispatcher. When in ViewModel, the following code can be used:
private void OnTimerElapsed(object sender, ElapsedEventArgs e){
ViewModelBase.InvokeOnUIThread(() =>
{
for (int i = 0; i < Items.Count; i++)
{
Items[i].X += (_random.NextDouble() - 0.5) * 0.1;
Items[i].Y += (_random.NextDouble() - 0.5) * 0.1;
}
});
}