Legend Item Text is not visible in Windows11Dark. This is because the LegendItem A possible workaround is to subscribe to the VisualItemCreating event. In the event handler, we can create a new LegendItemElement and set its ForeColor.
private void LegendElement_VisualItemCreating(object sender, LegendItemElementCreatingEventArgs e)
{
    e.ItemElement = new LegendItemElement(e.LegendItem) { ForeColor = Color.Black };
}
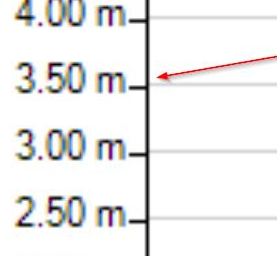
Before zoom:
After zoom:

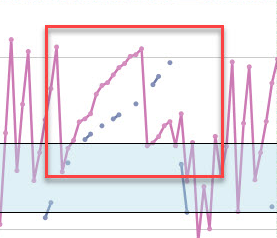
Please refer to the attached sample project. Try to select a point.
Expected result: the clicked point should be colored in red.
Actual result: a random point is colored in red even though the label is colored correctly. The attached gif file illustrates the observed result.
System.OverflowException: 'Value was either too large or too small for a Decimal.
To reproduce:
var lineSeries = new LineSeries();
lineSeries.DataPoints.Add(new CategoricalDataPoint(0, "A"));
lineSeries.DataPoints.Add(new CategoricalDataPoint(Convert.ToDouble(decimal.MaxValue), "B"));
lineSeries.DataPoints.Add(new CategoricalDataPoint(0, "C"));
lineSeries.DataPoints.Add(new CategoricalDataPoint(decimal.ToDouble(decimal.MaxValue), "D"));
lineSeries.DataPoints.Add(new CategoricalDataPoint(0, "E"));

this.radChartView1.Series.Add(lineSeries);
radChartView1.AreaType = ChartAreaType.Cartesian;
var scatterSeries = new ScatterSeries();
scatterSeries.DataPoints.Add(new ScatterDataPoint(15, 19));
scatterSeries.DataPoints.Add(new ScatterDataPoint(18, 10));
scatterSeries.DataPoints.Add(new ScatterDataPoint(13, 15));
scatterSeries.DataPoints.Add(new ScatterDataPoint(10, 8));
scatterSeries.DataPoints.Add(new ScatterDataPoint(5, 12));
radChartView1.Series.Add(scatterSeries);
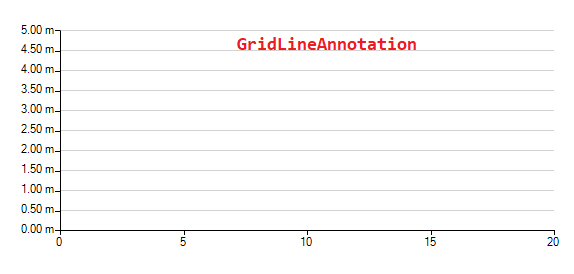
var verticalAxis = radChartView1.Axes.Get<LinearAxis>(1);
verticalAxis.Minimum = 0.0d;
verticalAxis.Maximum = 5.0d;
verticalAxis.MajorStep = 0.5d;
verticalAxis.LabelFormat = "{0:0.00} m";
for (var i = verticalAxis.Minimum; i <= verticalAxis.Maximum; i += verticalAxis.MajorStep)
{
var annotation1 = new CartesianGridLineAnnotation();
annotation1.Axis = this.radChartView1.Axes[1] as CartesianAxis;
annotation1.BorderColor = Color.LightGray;
annotation1.BorderDashStyle = DashStyle.Solid;
annotation1.BorderWidth = 1;
annotation1.Value = i;
radChartView1.Annotations.Add(annotation1);
}Workaround:
        public RadForm1()
        {
            InitializeComponent();

            this.radChartView1.CreateRenderer += radChartView1_CreateRenderer;
            InitChart();
        }

        private void radChartView1_CreateRenderer(object sender, ChartViewCreateRendererEventArgs e)
        {
            e.Renderer = new CustomRenderer(e.Area as CartesianArea);
        }

        public class CustomRenderer : CartesianRenderer
        {
            public CustomRenderer(CartesianArea area) : base(area)
            {
            }

            protected override void InitializeAnnotations(AnnotationDrawMode drawMode)
            {
                for (int i = 0; i < this.Area.Annotations.Count; i++)
                {
                    if (this.Area.Annotations[i] is CartesianGridLineAnnotation && this.Area.Annotations[i].DrawMode == drawMode)
                    {
                        this.DrawParts.Add(new CustomCartesianGridLineAnnotationDrawPart(this.Area.Annotations[i] as CartesianGridLineAnnotation, this));
                    }
                }
            }
        }

        public class CustomCartesianGridLineAnnotationDrawPart : CartesianGridLineAnnotationDrawPart
        {
            public CustomCartesianGridLineAnnotationDrawPart(CartesianGridLineAnnotation element, CartesianRenderer renderer) : base(element, renderer)
            {
            }

            public override void Draw()
            {
                FieldInfo fi = typeof(CartesianGridLineAnnotation).GetField("model", BindingFlags.Instance | BindingFlags.NonPublic);
                ChartAnnotationModel model = fi.GetValue(this.Element) as ChartAnnotationModel;
                RectangleF rect = ChartRenderer.ToRectangleF(model.LayoutSlot);
                rect.Offset(this.ViewportOffsetX, this.ViewportOffsetY);
                rect.Offset(new PointF(0,1));
                Graphics graphics = this.Renderer.Surface as Graphics;
                RadGdiGraphics radGraphics = new RadGdiGraphics(graphics);

                Rectangle clipRect = ChartRenderer.ToRectangle(this.Element.View.GetArea<CartesianArea>().AreaModel.PlotArea.LayoutSlot);
                clipRect.Offset((int)this.ViewportOffsetX, (int)this.ViewportOffsetY);
                graphics.SetClip(clipRect);

                GraphicsPath path = new GraphicsPath();
                path.AddLine(rect.Location, new PointF(rect.Right, rect.Bottom));

                BorderPrimitiveImpl border = new BorderPrimitiveImpl(this.Element, null);
                border.PaintBorder(radGraphics, null, path, rect);

                rect.Size = graphics.MeasureString(this.Element.Label, this.Element.Font);
                rect.Offset(this.Element.PositonOffset.Width + 1, this.Element.PositonOffset.Height + 1);

                TextParams tp = new TextParams();
                tp.font = this.Element.Font;
                tp.foreColor = this.Element.ForeColor;
                tp.paintingRectangle = new RectangleF(rect.X, rect.Y, rect.Height, rect.Width);
                tp.text = this.Element.Label;

                FillPrimitiveImpl fill = new FillPrimitiveImpl(this.Element, null);
                fill.PaintFill(radGraphics, null, rect);

                radGraphics.DrawString(tp, new SizeF(rect.Height, rect.Width));
            }
        }
Public Class RadForm2
    Public Sub New()
        InitializeComponent()

        AddHandler Me.RadChartView1.CreateRenderer, AddressOf radChartView1_CreateRenderer

        Me.RadChartView1.ShowSmartLabels = True
        Me.RadChartView1.ShowPanZoom = True

        Dim barSeries As New BarSeries()
        Dim barSeries1 As New BarSeries()
        Dim barSeries2 As New BarSeries()
        Dim rand As New Random()
        barSeries.DataPoints.Add(New CategoricalDataPoint(101, 0))
        barSeries1.DataPoints.Add(New CategoricalDataPoint(101, 0))
        barSeries2.DataPoints.Add(New CategoricalDataPoint(101, 0))
        For i As Integer = 1 To 9
            barSeries.DataPoints.Add(New CategoricalDataPoint(rand.[Next](100), i))
            barSeries1.DataPoints.Add(New CategoricalDataPoint(rand.[Next](100), i))
            barSeries2.DataPoints.Add(New CategoricalDataPoint(rand.[Next](100), i))
        Next

        barSeries.ShowLabels = True
        barSeries.DrawLinesToLabels = True
        barSeries1.ShowLabels = True
        barSeries1.DrawLinesToLabels = True
        barSeries2.ShowLabels = True
        barSeries2.DrawLinesToLabels = True

        Me.RadChartView1.Series.Add(barSeries)
        Me.RadChartView1.Series.Add(barSeries1)
        Me.RadChartView1.Series.Add(barSeries2)
    End Sub

    Private Sub radChartView1_CreateRenderer(sender As Object, e As ChartViewCreateRendererEventArgs)
        'e.Renderer = New CustomCartesianRenderer(TryCast(e.Area, CartesianArea))
    End Sub
End Class


Workaround: Create a custom renderer
Public Class CustomCartesianRenderer
    Inherits CartesianRenderer
    Public Sub New(area As CartesianArea)
        MyBase.New(area)
    End Sub

    Protected Overrides Sub Initialize()
        MyBase.Initialize()

        For i As Integer = 0 To Me.DrawParts.Count - 1
            Dim labelPart As BarLabelElementDrawPart = TryCast(Me.DrawParts(i), BarLabelElementDrawPart)
            If labelPart IsNot Nothing Then
                Me.DrawParts(i) = New CustomBarLabelElementDrawPart(DirectCast(labelPart.Element, BarSeries), Me)
            End If
        Next
    End Sub
End Class

Public Class CustomBarLabelElementDrawPart
    Inherits BarLabelElementDrawPart
    Public Sub New(owner As ChartSeries, renderer As IChartRenderer)
        MyBase.New(owner, renderer)
    End Sub

    Public Overrides Sub Draw()
        Dim graphics As Graphics = TryCast(Me.Renderer.Surface, Graphics)
        Dim cartesianSeries As CartesianSeries = TryCast(Me.Element, CartesianSeries)
        If cartesianSeries IsNot Nothing Then
            Dim area As CartesianArea = DirectCast(cartesianSeries.[GetType]().GetField("area", BindingFlags.Instance Or BindingFlags.NonPublic).GetValue(cartesianSeries), CartesianArea)
            Dim clipRect As RectangleF = DirectCast(area.[GetType]().GetMethod("GetCartesianClipRect", BindingFlags.Instance Or BindingFlags.NonPublic).Invoke(area, New Object() {}), RectangleF)

            graphics.SetClip(clipRect)
        End If

        MyBase.Draw()

        graphics.ResetClip()
    End Sub

    Protected Overrides Function GetLineStart(label As LabelElement, point As DataPointElement, isSmartLabel As Boolean) As PointF
        Dim lineStart As PointF = MyBase.GetLineStart(label, point, isSmartLabel)

        Dim x As Single = CSng(TryCast(Me.Element.View, IChartView).PlotOriginX)
        Dim y As Single = CSng(TryCast(Me.Element.View, IChartView).PlotOriginY)

        lineStart.X += x
        lineStart.Y += y

        Return lineStart
    End Function

    Protected Overrides Function GetLineEnd(label As LabelElement, point As DataPointElement, isSmartLabel As Boolean) As PointF
        Dim lineEnd As PointF = MyBase.GetLineEnd(label, point, isSmartLabel)

        If Not isSmartLabel Then
            Dim x As Single = CSng(TryCast(Me.Element.View, IChartView).PlotOriginX)
            Dim y As Single = CSng(TryCast(Me.Element.View, IChartView).PlotOriginY)
            lineEnd.X += x
            lineEnd.Y += y
        End If

        Return lineEnd
    End Function
End Class
Note: similar to the axis, the series should also have ClipLabels property which will control whether the labels will be clipped or not.

How to reproduce: zoom and pan along the chart
public Form1()
{
    InitializeComponent();

    this.radChartView1.CreateRenderer += radChartView1_CreateRenderer;
    this.radChartView1.ShowPanZoom = true;

    BarSeries barSeries = new BarSeries();
    Random rand = new Random();
    for (int i = 1; i < 10; i++)
    {
        barSeries.DataPoints.Add(new CategoricalDataPoint(rand.Next(100), i));
    }

    barSeries.ShowLabels = true;
    this.radChartView1.Series.Add(barSeries);
}

Workaround:
 public partial class Form1 : Form
 {
     public Form1()
     {
         InitializeComponent();

         this.radChartView1.CreateRenderer += radChartView1_CreateRenderer;
         this.radChartView1.ShowPanZoom = true;

         BarSeries barSeries = new BarSeries();
         Random rand = new Random();
         for (int i = 1; i < 10; i++)
         {
             barSeries.DataPoints.Add(new CategoricalDataPoint(rand.Next(100), i));
         }

         barSeries.ShowLabels = true;
         this.radChartView1.Series.Add(barSeries);
     }

     private void radChartView1_CreateRenderer(object sender, ChartViewCreateRendererEventArgs e)
     {
         e.Renderer = new CustomCartesianRenderer(e.Area as CartesianArea);
     }
 }

 public class CustomCartesianRenderer : CartesianRenderer
 {
     public CustomCartesianRenderer(CartesianArea area)
         : base(area)
     { }
     protected override void Initialize()
     {
         base.Initialize();

         for (int i = 0; i < this.DrawParts.Count; i++)
         {
             BarLabelElementDrawPart labelPart = this.DrawParts[i] as BarLabelElementDrawPart;
             if (labelPart != null)
             {
                 this.DrawParts[i] = new CustomLabelElementDrawPart((BarSeries)labelPart.Element, this);
             }
         }
     }
 }

 public class CustomLabelElementDrawPart : BarLabelElementDrawPart
 {
     public CustomLabelElementDrawPart(ChartSeries owner, IChartRenderer renderer)
         : base(owner, renderer)
     { }

     public override void Draw()
     {
         Graphics graphics = this.Renderer.Surface as Graphics;
         CartesianSeries cartesianSeries = this.Element as CartesianSeries;
         if (cartesianSeries != null)
         {
             CartesianArea area = (CartesianArea)cartesianSeries.GetType().GetField("area", BindingFlags.Instance | BindingFlags.NonPublic).GetValue(cartesianSeries);
             RectangleF clipRect = (RectangleF)area.GetType().GetMethod("GetCartesianClipRect", BindingFlags.Instance | BindingFlags.NonPublic).Invoke(area, new object[] { });//.GetCartesianClipRect();
             graphics.SetClip(clipRect);
         }

         base.Draw();

         graphics.ResetClip();
     }
 }
Hi team,
We need a ChartView with multiple series and multiple Y-axis. The axis color of each Y-axis should be automatically painted according to the palette setting (thank you for the brilliant work - it's very intuitive). However, if clear the series and re-assign a new set of series, the border color of the first axis changes to black, regardless which palette is active. If the palette is set to a new one, the border color can be re-painted correctly. See screenshot as attached.
How to reproduce: Please refer to the attached project for a demo of reproduction. Click the first button to populate new random data. The border color of the first axis should change to black after clicking the button twice and more times. Clicking the second button will force the palette to change and the border color will become normal.
Thank you, team.
Best,
Yusi
When you have BarSeries and LineSeries in RadChartView the problem is that the DataPoint.Presenter is always BarSerries, never LineSeries.
To workaround, create custom renderer:
this.radChartView1.CreateRenderer += this.RadChartView1_CreateRenderer;
private void RadChartView1_CreateRenderer(object sender, ChartViewCreateRendererEventArgs e)
{
    e.Renderer = new CustomCartesianRenderer(e.Area as CartesianArea);
}

public class CustomCartesianRenderer : CartesianRenderer
{
    public CustomCartesianRenderer(CartesianArea area)
        : base(area)
    { }
    public override DataPoint HitTest(int x, int y)
    {
        for (int i = this.DrawParts.Count - 1; i >= 0; i--)
        {
            DataPoint dataPoint = this.DrawParts[i].HitTest(new Point(x, y));
            if (dataPoint != null)
            {
                return dataPoint;
            }
        }

        return base.HitTest(x, y);
    }
}
Use attached to reproduce.
- Click at least 7 times.
Workaround: Crete new series instance each time.
Stack trace:
System.NullReferenceException occurred
HResult=-2147467261
Message=Object reference not set to an instance of an object.
Source=Telerik.WinControls.ChartView
StackTrace:
at Telerik.Charting.CombinedBarSeriesRoundLayoutStrategy.ApplyLayoutRoundingVertical(LayoutContext context) in c:\Work\Development\RadControls\RadChartView\Engine\Series\Combination\BarSeries\CombinedBarSeriesRoundLayoutStrategy.cs:line 206
InnerException:
Inside the constructor of a form create a pie series and populate it with data. Then add it to a RadChartView. You will notice that there are two legend items per data point.
Use attached to reproduce.
Workaround:
series.DataPoints.Add(new PieDataPoint(0.01, "Germany"));series.DataPoints.Add(new PieDataPoint(0.01, "United States"));
To reproduce:
- Just add StochasticSlowIndicator to a chart.
To reproduce:

1. Perform zoom and pan operation and click the print/print preview button:
2. You will notice that the printed chart is not exactly the same as the displayed one. Please refer to the attached screenshot.

public Form1()
{
    InitializeComponent();

    LineSeries lineSeries = new LineSeries();
    lineSeries.DataPoints.Add(new CategoricalDataPoint(20, "Jan"));
    lineSeries.DataPoints.Add(new CategoricalDataPoint(22, "Apr"));
    lineSeries.DataPoints.Add(new CategoricalDataPoint(12, "Jul"));
    lineSeries.DataPoints.Add(new CategoricalDataPoint(19, "Oct"));
    this.radChartView1.Series.Add(lineSeries);

    LineSeries lineSeries2 = new LineSeries();
    lineSeries2.DataPoints.Add(new CategoricalDataPoint(18, "Jan"));
    lineSeries2.DataPoints.Add(new CategoricalDataPoint(15, "Apr"));
    lineSeries2.DataPoints.Add(new CategoricalDataPoint(17, "Jul"));
    lineSeries2.DataPoints.Add(new CategoricalDataPoint(22, "Oct"));
    this.radChartView1.Series.Add(lineSeries2);

    ChartPanZoomController panZoomController = new ChartPanZoomController();
    panZoomController.PanZoomMode = ChartPanZoomMode.Horizontal;
    radChartView1.Controllers.Add(panZoomController);
}

private void radButton1_Click(object sender, EventArgs e)
{
    this.radChartView1.PrintPreview();
}

3.The issue also appears when the LassoZoomController is used.
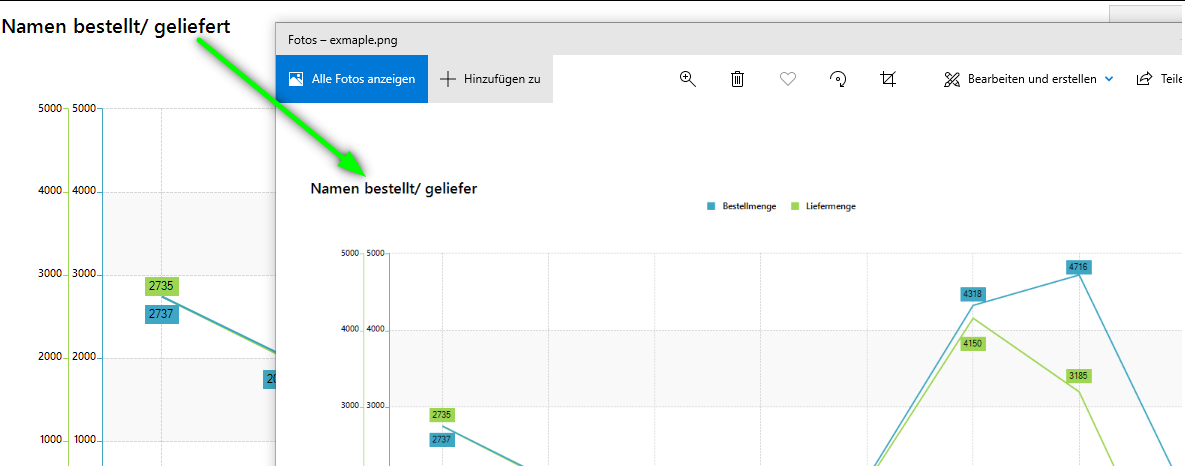
After 1 million the decimal places of the labels are not correct, In your image. the labels on the horizontal axis go 999,992.50 - 999,995.00 - 999,997.5 - 1,000,000.00 - *1,000,003.00(should be 1,000,002.50) - 1,000,005.00 - *1,000,008.00(should be 1,000,007.5)
To reproduce:
- Add a chart to the form and set series with DataSource
- Close and dispose the form

Workaround:
Set the DataSource property of the series to null prior closing.