The same issue can be observed in a DPI-aware application on higher scaling
Workaround: set the RadControl.EnableDpiScaling property to false

public partial class Form1 : Form
{
    public Form1()
    {
        RadControl.EnableDpiScaling = false;

        InitializeComponent();

        LineSeries lineSeries = new LineSeries();
        lineSeries.DataPoints.Add(new CategoricalDataPoint(20, "Jan"));
        lineSeries.DataPoints.Add(new CategoricalDataPoint(22, "Apr"));
        lineSeries.DataPoints.Add(new CategoricalDataPoint(12, "Jul"));
        lineSeries.DataPoints.Add(new CategoricalDataPoint(19, "Oct"));
        this.radChartView1.Series.Add(lineSeries);

        LineSeries lineSeries2 = new LineSeries();
        lineSeries2.DataPoints.Add(new CategoricalDataPoint(18, "Jan"));
        lineSeries2.DataPoints.Add(new CategoricalDataPoint(15, "Apr"));
        lineSeries2.DataPoints.Add(new CategoricalDataPoint(17, "Jul"));
        lineSeries2.DataPoints.Add(new CategoricalDataPoint(22, "Oct"));
        this.radChartView1.Series.Add(lineSeries2);

        LassoZoomController lassoZoomController = new LassoZoomController();
        radChartView1.Controllers.Add(lassoZoomController);
    }

    private void radButton1_Click(object sender, EventArgs e)
    {
        this.radChartView1.ExportToImage(@"..\..\image.png", this.radChartView1.Size);
    }
}
To reproduce:
            DataTable table = new DataTable();
            table.Columns.Add("Value", typeof(double));
            table.Columns.Add("Name", typeof(string));
            table.Rows.Add(1, "John");
            table.Rows.Add(3, "Adam");
            table.Rows.Add(5, "Peter");
            table.Rows.Add(12, "Sam");
            table.Rows.Add(6, "Paul");

            BarSeries lineSeria = new BarSeries();
            radChartView1.Series.Add(lineSeria);
            lineSeria.ValueMember = "Value";
            lineSeria.CategoryMember = "Name";

            this.radChartView1.DataSource = table;

        private void radButton1_Click(object sender, EventArgs e)
        {
            this.radChartView1.DataSource = null;
        }

The chart data will be still visible. It is necessary to set explicitly the DataSource of the series:
this.radChartView1.Series[0].DataSource = null;
To reproduce: run the attached sample project and you will notice that the data points are not properly aligned.

Workaround: use equal number of data points for the series.
To reproduce: please refer to the attached sample project  and gif file illustrating the behavior on my end.

Note: similar to the axis, the series should also have ClipLabels property which will control whether the labels will be clipped or not.

Workaround: use custom renderer:

 Sub New()

        InitializeComponent()

        AddHandler Me.RadChartView1.CreateRenderer, AddressOf RadChartView1_CreateRenderer

        Dim barSeries As New Telerik.WinControls.UI.BarSeries("Performance", "RepresentativeName")
        barSeries.Name = "Q1"
        barSeries.ShowLabels = True
        barSeries.DataPoints.Add(New CategoricalDataPoint(177, "Harley"))
        barSeries.DataPoints.Add(New CategoricalDataPoint(128, "White"))
        barSeries.DataPoints.Add(New CategoricalDataPoint(143, "Smith"))
        barSeries.DataPoints.Add(New CategoricalDataPoint(111, "Jones"))
        barSeries.DataPoints.Add(New CategoricalDataPoint(118, "Marshall"))
        Me.RadChartView1.Series.Add(barSeries)
        Dim barSeries2 As New Telerik.WinControls.UI.BarSeries("Performance", "RepresentativeName")
        barSeries2.Name = "Q2"
        barSeries2.ShowLabels = True
        barSeries2.DataPoints.Add(New CategoricalDataPoint(153, "Harley"))
        barSeries2.DataPoints.Add(New CategoricalDataPoint(141, "White"))
        barSeries2.DataPoints.Add(New CategoricalDataPoint(130, "Smith"))
        barSeries2.DataPoints.Add(New CategoricalDataPoint(88, "Jones"))
        barSeries2.DataPoints.Add(New CategoricalDataPoint(109, "Marshall"))
        Me.RadChartView1.Series.Add(barSeries2)


        Dim lassoZoomController As New ChartPanZoomController()
        RadChartView1.Controllers.Add(lassoZoomController)

    End Sub

    Public Class CustomLabelElementDrawPart
        Inherits BarLabelElementDrawPart
        Public Sub New(owner As ChartSeries, renderer As IChartRenderer)
            MyBase.New(owner, renderer)

        End Sub

        Public Overrides Sub Draw()
            If Not Me.Element.ShowLabels Then
                Return
            End If

            Dim graphics As Graphics = TryCast(Me.Renderer.Surface, Graphics)
            Dim radGraphics As RadGdiGraphics = New RadGdiGraphics(graphics)
            Dim isSmartLabelsEnabled As Boolean = Me.Element.View.ShowSmartLabels
            Dim isLineToLabelEnabled As Boolean = Me.Element.DrawLinesToLabels

            For Each dataPointElement As DataPointElement In Me.Element.Children
                Dim categoricalDataPoint As CategoricalDataPoint = TryCast(dataPointElement.DataPoint, CategoricalDataPoint)


                For i As Integer = 0 To dataPointElement.Children.Count - 1
                    Dim labelElement As LabelElement = TryCast(dataPointElement.Children(i), LabelElement)

                    If labelElement Is Nothing Then
                        Continue For
                    End If

                    labelElement.OnLabelFormatting(New ChartViewLabelFormattingEventArgs(labelElement))

                    If Not labelElement.IsVisible OrElse String.IsNullOrEmpty(labelElement.Text) Then
                        Continue For
                    End If

                    Dim rect As Rectangle
                    Dim slot As RadRect = labelElement.GetLayoutSlot()

                    If isSmartLabelsEnabled AndAlso labelElement.SmartRectangle <> Rectangle.Empty Then
                        rect = labelElement.SmartRectangle
                    Else
                        slot = AdjustLayoutSlot(slot, labelElement.DataPointElement)
                        rect = ChartRenderer.ToRectangle(slot)
                    End If

                    Dim state As Object = radGraphics.SaveState()
                    Dim horizontalTranslate As Integer = rect.X + rect.Width / 2
                    Dim verticalTranslate As Integer = rect.Y + rect.Height / 2
                    Dim clipRect As RectangleF
                    If TypeOf Me.Renderer Is CartesianRenderer Then
                        Dim size As SizeF = graphics.MeasureString("W", Me.Element.Font)
                        Dim plotRect As RadRect = Me.Element.Model.LayoutSlot
                        plotRect.X += Me.ViewportOffsetX
                        plotRect.Y += Me.ViewportOffsetY
                        clipRect = ChartRenderer.ToRectangleF(plotRect)
                        clipRect.Y -= size.Height / 2.0F
                        clipRect.Height += size.Height
                        clipRect.Width += size.Width * 2.0F
                        graphics.SetClip(clipRect)
                    End If

                    Dim angle As Single = CSng(Me.Element.LabelRotationAngle) Mod 360.0F

                    If angle <> 0 Then
                        radGraphics.TranslateTransform(horizontalTranslate, verticalTranslate)
                        radGraphics.RotateTransform(angle)
                        radGraphics.TranslateTransform(-horizontalTranslate, -verticalTranslate)
                    End If

                    If isLineToLabelEnabled Then
                        Me.DrawConnectingLine(radGraphics, labelElement, dataPointElement, isSmartLabelsEnabled AndAlso labelElement.SmartRectangle <> Rectangle.Empty)
                    End If

                    If labelElement.BackgroundShape IsNot Nothing Then
                        labelElement.BackgroundShape.Paint(CType(radGraphics.UnderlayGraphics, Graphics), rect)
                    End If

                    Dim fill As Telerik.WinControls.Primitives.FillPrimitiveImpl = New Telerik.WinControls.Primitives.FillPrimitiveImpl(labelElement, Nothing)
                    fill.PaintFill(radGraphics, 0, System.Drawing.Size.Empty, rect)
                    Dim border As Telerik.WinControls.Primitives.BorderPrimitiveImpl = New Telerik.WinControls.Primitives.BorderPrimitiveImpl(labelElement, Nothing)
                    border.PaintBorder(radGraphics, 0, System.Drawing.Size.Empty, rect)

                    Using brush As Brush = New SolidBrush(labelElement.ForeColor)
                        Dim drawRectangle As RectangleF = New RectangleF()
                        drawRectangle.X = rect.X + labelElement.Padding.Left
                        drawRectangle.Y = rect.Y + labelElement.Padding.Top
                        drawRectangle.Width = rect.Width - labelElement.Padding.Right
                        drawRectangle.Height = rect.Height - labelElement.Padding.Bottom
                        Dim format As StringFormat = New StringFormat()
                        format.Alignment = ContentAlignmentToHorizontalStringAlignment(labelElement.TextAlignment)
                        format.LineAlignment = Me.ContentAlignmentToVerticalStringAlignment(labelElement.TextAlignment)
                        graphics.DrawString(labelElement.Text, labelElement.Font, brush, drawRectangle, format)
                    End Using

                    If angle <> 0 Then
                        radGraphics.ResetTransform()
                        radGraphics.RestoreState(state)
                    End If

                    graphics.ResetClip()
                Next
            Next
        End Sub

        Public Function ContentAlignmentToVerticalStringAlignment(ByVal contentAlignment As ContentAlignment) As StringAlignment
            Dim result As StringAlignment

            Select Case contentAlignment
                Case contentAlignment.BottomCenter, contentAlignment.BottomLeft, contentAlignment.BottomRight
                    result = StringAlignment.Far
                Case contentAlignment.TopCenter, contentAlignment.TopLeft, contentAlignment.TopRight
                    result = StringAlignment.Near
                Case Else
                    result = StringAlignment.Center
            End Select

            Return result
        End Function

        Private Function ContentAlignmentToHorizontalStringAlignment(ByVal contentAlignment As ContentAlignment) As StringAlignment
            Dim result As StringAlignment

            Select Case contentAlignment
                Case contentAlignment.BottomLeft, contentAlignment.MiddleLeft, contentAlignment.TopLeft
                    result = StringAlignment.Near
                Case contentAlignment.BottomRight, contentAlignment.MiddleRight, contentAlignment.TopRight
                    result = StringAlignment.Far
                Case Else
                    result = StringAlignment.Center
            End Select

            Return result
        End Function

    End Class

    Private Sub RadChartView1_CreateRenderer(sender As Object, e As ChartViewCreateRendererEventArgs)
        e.Renderer = New CustomCartesianRenderer(e.Area)
    End Sub

    Public Class CustomCartesianRenderer
        Inherits CartesianRenderer
        Public Sub New(area As CartesianArea)
            MyBase.New(area)
        End Sub
        Protected Overrides Sub Initialize()
            MyBase.Initialize()
            For i As Integer = 0 To Me.DrawParts.Count - 1

                Dim label As BarLabelElementDrawPart = TryCast(Me.DrawParts(i), BarLabelElementDrawPart)
                If (label IsNot Nothing) Then
                    Me.DrawParts(i) = New CustomLabelElementDrawPart(label.Element, Me)
                End If
            Next
        End Sub
    End Class
To reproduce:
- Add a chart to the form and set series with DataSource
- Close and dispose the form

Workaround:
Set the DataSource property of the series to null prior closing.
After 1 million the decimal places of the labels are not correct, In your image. the labels on the horizontal axis go 999,992.50 - 999,995.00 - 999,997.5 - 1,000,000.00 - *1,000,003.00(should be 1,000,002.50) - 1,000,005.00 - *1,000,008.00(should be 1,000,007.5)
Use attached to reproduce.
Workaround:
series.DataPoints.Add(new PieDataPoint(0.01, "Germany"));series.DataPoints.Add(new PieDataPoint(0.01, "United States"));
Stack trace:
System.NullReferenceException occurred
HResult=-2147467261
Message=Object reference not set to an instance of an object.
Source=Telerik.WinControls.ChartView
StackTrace:
at Telerik.Charting.CombinedBarSeriesRoundLayoutStrategy.ApplyLayoutRoundingVertical(LayoutContext context) in c:\Work\Development\RadControls\RadChartView\Engine\Series\Combination\BarSeries\CombinedBarSeriesRoundLayoutStrategy.cs:line 206
InnerException:
When you have BarSeries and LineSeries in RadChartView the problem is that the DataPoint.Presenter is always BarSerries, never LineSeries.
To workaround, create custom renderer:
this.radChartView1.CreateRenderer += this.RadChartView1_CreateRenderer;
private void RadChartView1_CreateRenderer(object sender, ChartViewCreateRendererEventArgs e)
{
    e.Renderer = new CustomCartesianRenderer(e.Area as CartesianArea);
}

public class CustomCartesianRenderer : CartesianRenderer
{
    public CustomCartesianRenderer(CartesianArea area)
        : base(area)
    { }
    public override DataPoint HitTest(int x, int y)
    {
        for (int i = this.DrawParts.Count - 1; i >= 0; i--)
        {
            DataPoint dataPoint = this.DrawParts[i].HitTest(new Point(x, y));
            if (dataPoint != null)
            {
                return dataPoint;
            }
        }

        return base.HitTest(x, y);
    }
}
Please refer to the attached sample project. Select a range from RadRangeSelector and print the chart. You will notice that the preview chart is shifted. Even if the the default margin is reduced to 0, the preview chart is not the same as the one displayed on the form.
Workaround: export the chart to a file which file can be printed: https://docs.telerik.com/devtools/winforms/controls/chartview/features/export
Good day,
My requierment is to have a RadChartView with a LineSeries and a RangeSeries. I add CategoricalDataPoint objects manually to the LineSeries and I manually add RangeDataPoint objects to the RangeSeries.
When I encounter NULL valued datapoints, for the LineSeries, I do the following. The NULL valued datapoints appear as gaps in the chart as expected.
Dim value As Nullable(Of Double)
Dim serControl  As  LineSeries

serControl = New LineSeries()
chart.Series.Add(serControl)
value = IIf(IsDBNull(dr(data.ControlParameter.ID.ToString())), New Nullable(Of Double), dr(data.ControlParameter.ID.ToString()))
serControl.DataPoints.Add(New Telerik.Charting.CategoricalDataPoint(value))
However the RangeSeries do not handle the NULL valued datapoints the same. I get the following error: Nullable object must have a value.
Dim LowerBound, UpperBound As Nullable(Of Double)
Dim serRange  As  RangeSeries

serRange = New RangeSeries()
chart.Series.Add(serRange)
LowerBound = IIf(IsDBNull(dr("Lowerbound"), New Nullable(Of Double), dr("LowerBound"))
UpperBound = IIf(IsDBNull(dr("Upperbound"), New Nullable(Of Double), dr("UpperBound"))
serRange.DataPoints.Add(New Telerik.Charting.RangeDataPoint(UpperBound, LowerBound))
I need to be able to show gaps, not zero's in a RangeSeries when there are NULL values.
How can I do this?
Improve performance, when calculating the positions of Smart Labels.
Currently, VisualStudio2012DarkTheme has a white background in order to be able to read the labels. This change was done when addressing this item:
However, it is inconsistent a dark theme to have a white background color. The design should be improved to achieve consistent look and feel.
Use the following setup:
private void RadForm1_Load(object sender, EventArgs e)
{
// TODO: This line of code loads data into the 'nwindDataSet.Orders' table. You can move, or remove it, as needed.this.ordersTableAdapter.Fill(this.nwindDataSet.Orders);
this.radPivotGrid1.RowGroupDescriptions.Add(new DateTimeGroupDescription() { PropertyName = "OrderDate", Step = DateTimeStep.Year, GroupComparer = new GroupNameComparer() });
this.radPivotGrid1.RowGroupDescriptions.Add(new DateTimeGroupDescription() { PropertyName = "OrderDate", Step = DateTimeStep.Quarter, GroupComparer = new GroupNameComparer() });
this.radPivotGrid1.RowGroupDescriptions.Add(new DateTim
eGroupDescription() { PropertyName = "OrderDate", Step = DateTimeStep.Month, GroupComparer = new GroupNameComparer() });
this.radPivotGrid1.ColumnGroupDescriptions.Add(new PropertyGroupDescription() { PropertyName = "EmployeeID", GroupComparer = new GrandTotalComparer() });
this.radPivotGrid1.AggregateDescriptions.Add(new PropertyAggregateDescription() { PropertyName = "Freight", AggregateFunction = AggregateFunctions.Sum });
this.radPivotGrid1.AggregateDescriptions.Add(new PropertyAggregateDescription() { PropertyName = "Freight", AggregateFunction = AggregateFunctions.Average });
this.radPivotGrid1.FilterDescriptions.Add(new PropertyFilterDescription() { PropertyName = "ShipCountry", CustomName = "Country" });
this.radPivotGrid1.DataSource = this.ordersBindingSource;
this.radPivotGrid1.ChartDataProvider.UpdateCompleted += radPivotGrid1_UpdateCompleted;
this.radChartView1.DataSource = this.radPivotGrid1;
}
private void radPivotGrid1_UpdateCompleted(object sender, EventArgs e)
{
foreach (CartesianSeries series inthis.radChartView1.Series)
{
series.ShowLabels = true;
series.LabelRotationAngle = 90;
}
}
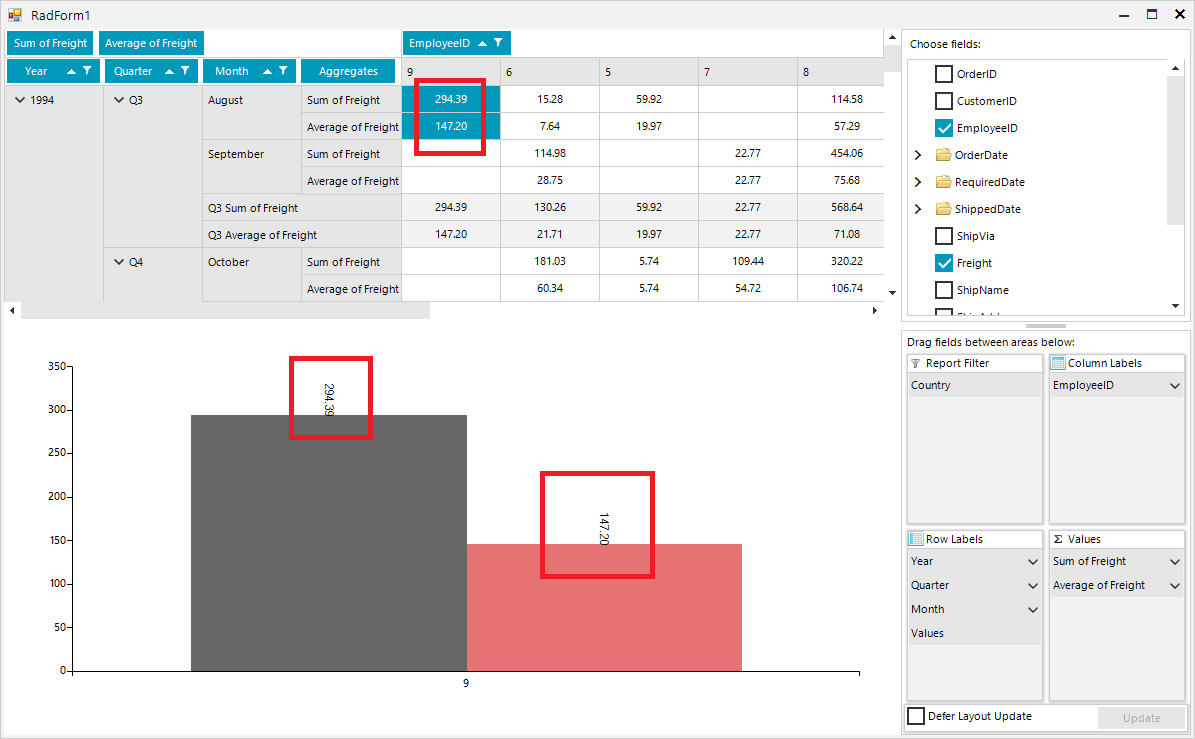
Once you select "% of Grand Total" for one of the aggregates, it would be good the respective chart labels to be formatted in a similar way out of the box:

Desired Behavior:
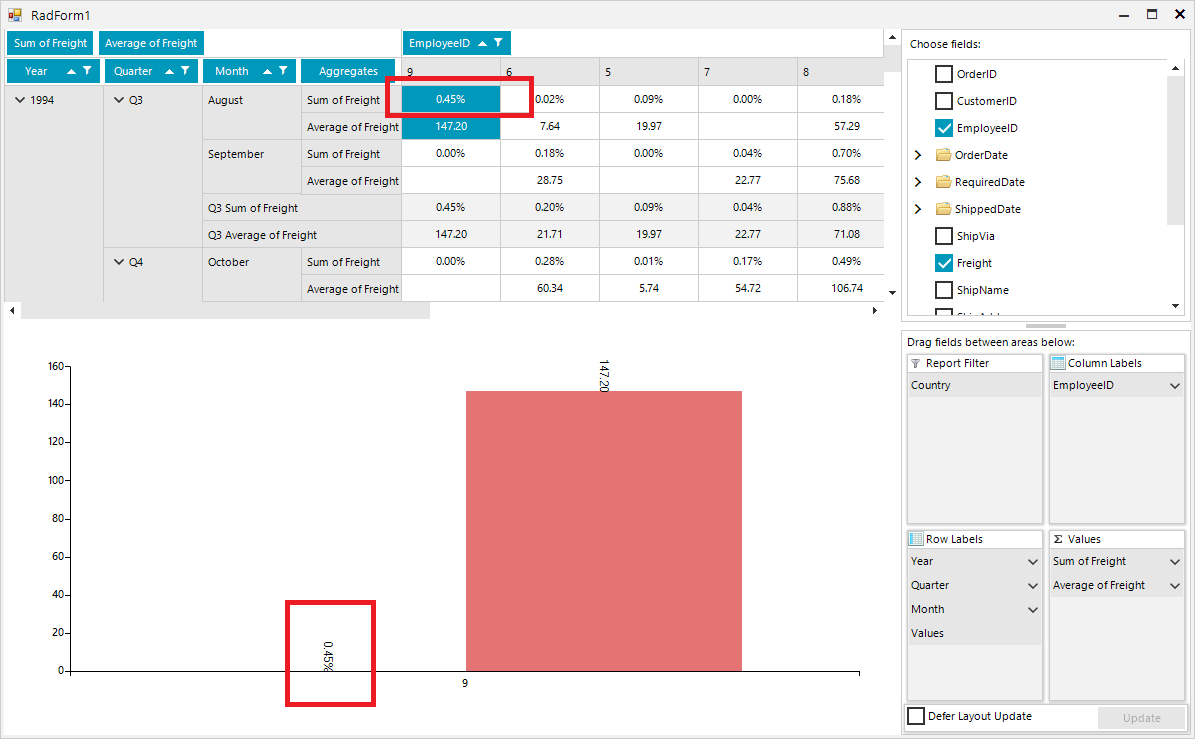
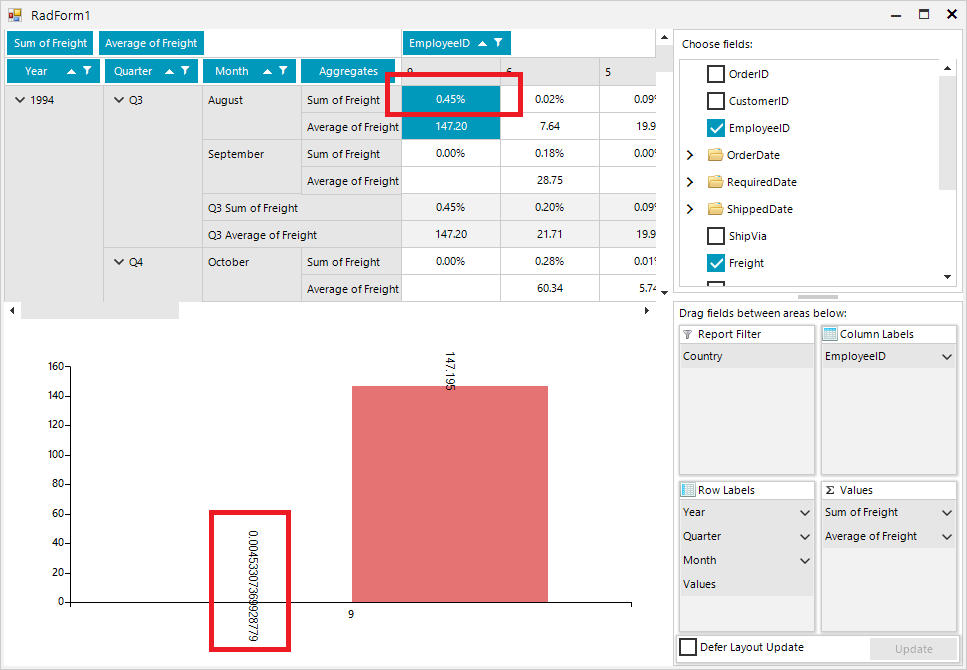
Actual behavior:
Before zoom:
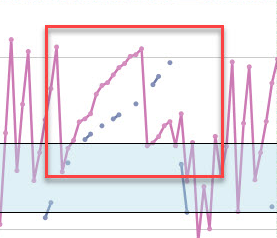
After zoom:

Legend Item Text is not visible in Windows11Dark. This is because the LegendItem A possible workaround is to subscribe to the VisualItemCreating event. In the event handler, we can create a new LegendItemElement and set its ForeColor.
private void LegendElement_VisualItemCreating(object sender, LegendItemElementCreatingEventArgs e)
{
    e.ItemElement = new LegendItemElement(e.LegendItem) { ForeColor = Color.Black };
}