Currently, the GetDesignerResource endpoint of the Web Report Designer service is case-insensitive, which can lead to issues if the URL is made lowercase at some point, such as by a URL rewrite rule, or similar scenarios.
For example, the following reference to the Web Report Designer script will load return the file:
<script src="api/reportdesigner/designerresources/js/webReportDesigner"></script>But if lowercase is used, for example, like this:
<script src="api/reportdesigner/designerresources/js/webreportdesigner"></script>The request will return a 404(Not Found) response.
Using the text-indent CSS setting results in part of the text on the first line being cut off:
I cannot localize the messages of the Angular and React report viewers using the suggested approaches:
- Angular Report Viewer Localization - Telerik Reporting
- Localizing the React Report Viewer - Telerik Reporting
The only alternative is to use the approach from the Localization of the HTML5 ReportViewer Explained - Telerik Reporting article, which I can do only by loading the string resources script in index.html of the SPA.
If I try to drag & drop fields in the Standalone Report Designer for .NET, it does not allow me to paste the field, and the icon changes, indicating that the action is not allowed.
On the other hand, I can drag & drop the fields as expected when using the Standalone Report Designer for .NET Framework.
On export to MS Word, a numbered list that spans two pages restarts at (1) on the second page. Instead, the numbered list should continue numbering from the first page.
For example, if a list has five items and the fourth item starts on a new page, when I export the report to MS Word, the first three items are numbered (1), (2), and (3), and the last two items are numbered (1) and (2) again. The last two items should be numbered (4) and (5).
In addition, if an item in a numbered list splits between two pages, the item is numbered twice: once at the beginning of the item and again on the first line that appears on the next page. The line at the top of the second page is numbered (1). This second number should not appear.
The attached file shows both these issues.
Is there a telerik reporting xml schema definition document somewhere? This is so that we can more effectively get AI to automatically build telerik reports.
When using A4 paper or narrow-edge leading media the Web Viewer prints everything perfectly.
When using a 60mm x 30mm label, therefore "wide-edge" leading media, the web viewer prints the label in landscape, even though the print is in portrait!
Just because the media is "landscape" surely it is the print on the media that determines the orientation?
When using the Windows System Print Dialogue this does not occur, on the using the print from the Web Viewer. This is because the Web Viewer converts it to PDF first to print (I believe). Surely, in the code you can state NOT to rotate, OR rotate it back to the correct orientation for wide edge leading media.
The label design is portrait so all the "print / pdf" code needs to do is to query this and not assume that wide edge leading media automatically prints in landscape.
When using the SqlDataSource component with a stored procedure that has an IF-ELSE condition which selects a different set of columns depending on whether the condition is true or false, the returned data schema is always as if the condition is evaluated to true.
While the schema is wrong, if I manually type the fields, at runtime, they get resolved correctly but it is inconvenient.
WPF report viewer crashes when launching it the second time. The issue appears to occur only when having a trial license activated.
System.Windows.Data Error: 23 : Cannot convert '<null>' from type '<null>' to type 'System.Uri' for 'en-US' culture with default conversions; consider using Converter property of Binding. NotSupportedException:'System.NotSupportedException: UriTypeConverter cannot convert from (null).
   at System.ComponentModel.TypeConverter.GetConvertFromException(Object value)
   at System.ComponentModel.TypeConverter.ConvertFrom(ITypeDescriptorContext context, CultureInfo culture, Object value)
   at System.UriTypeConverter.ConvertFrom(ITypeDescriptorContext context, CultureInfo culture, Object value)
   at MS.Internal.Data.DefaultValueConverter.ConvertHelper(Object o, Type destinationType, DependencyObject targetElement, CultureInfo culture, Boolean isForward)'
Exception thrown: 'System.NullReferenceException' in Telerik.ReportViewer.Wpf.dll
Object reference not set to an instance of an object.
I want to set the Table ColumnWidth to a particular value in the Properties of the Web Report Designer. There is no property ColumnWidth as in the Desktop designers, and I tried to set the Size.Width, which is available.
When I increased the Width from the Properties, in design time, there is no change in the column width, only dashed borders indicating the new size when selecting the corresponding TextBoxes. In runtime, though, the new size is respected.
The inconsistency repeats even when I open the saved report in another browser or through another application, hence this is not a caching issue.
I'm using VS 2022, the demo reporting (Telerik_Reporting_2026_Q1_20_0_26_211). When using the "Telerik Report 2026 Q1 Wizard", I select the following
- "Table Wizard"
- Current Data Sources
- Add New Data Sources
- Select "Object Data Sources
- I select my Assembly and data object.
- I select the Data source Member
See attach file when I finish the wizard.
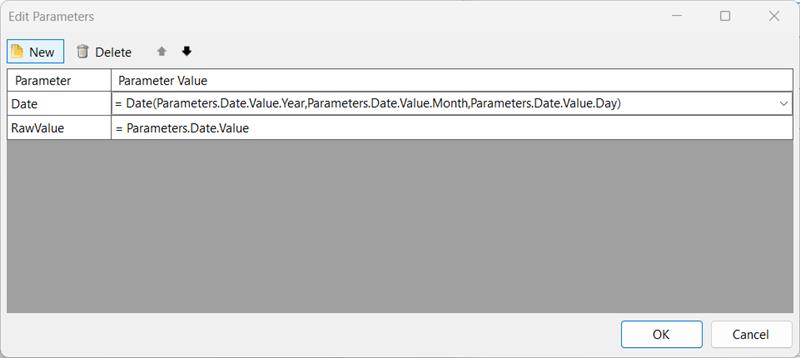
After updating to the Q1 2026 release of Reporting, I get the following error when passing the value of a DateTime parameter from the main report to a DateTime parameter of a report that I open via the Navigate To Report action:
CSharp.Net10.ReportingRestServiceCorsDemo Error: 0 : Parameter /Date(1771253073461)/ does not match Epoch regex format!
CSharp.Net10.ReportingRestServiceCorsDemo Error: 0 : Parameter /Date(1771253073461)/ does not match Epoch regex format!
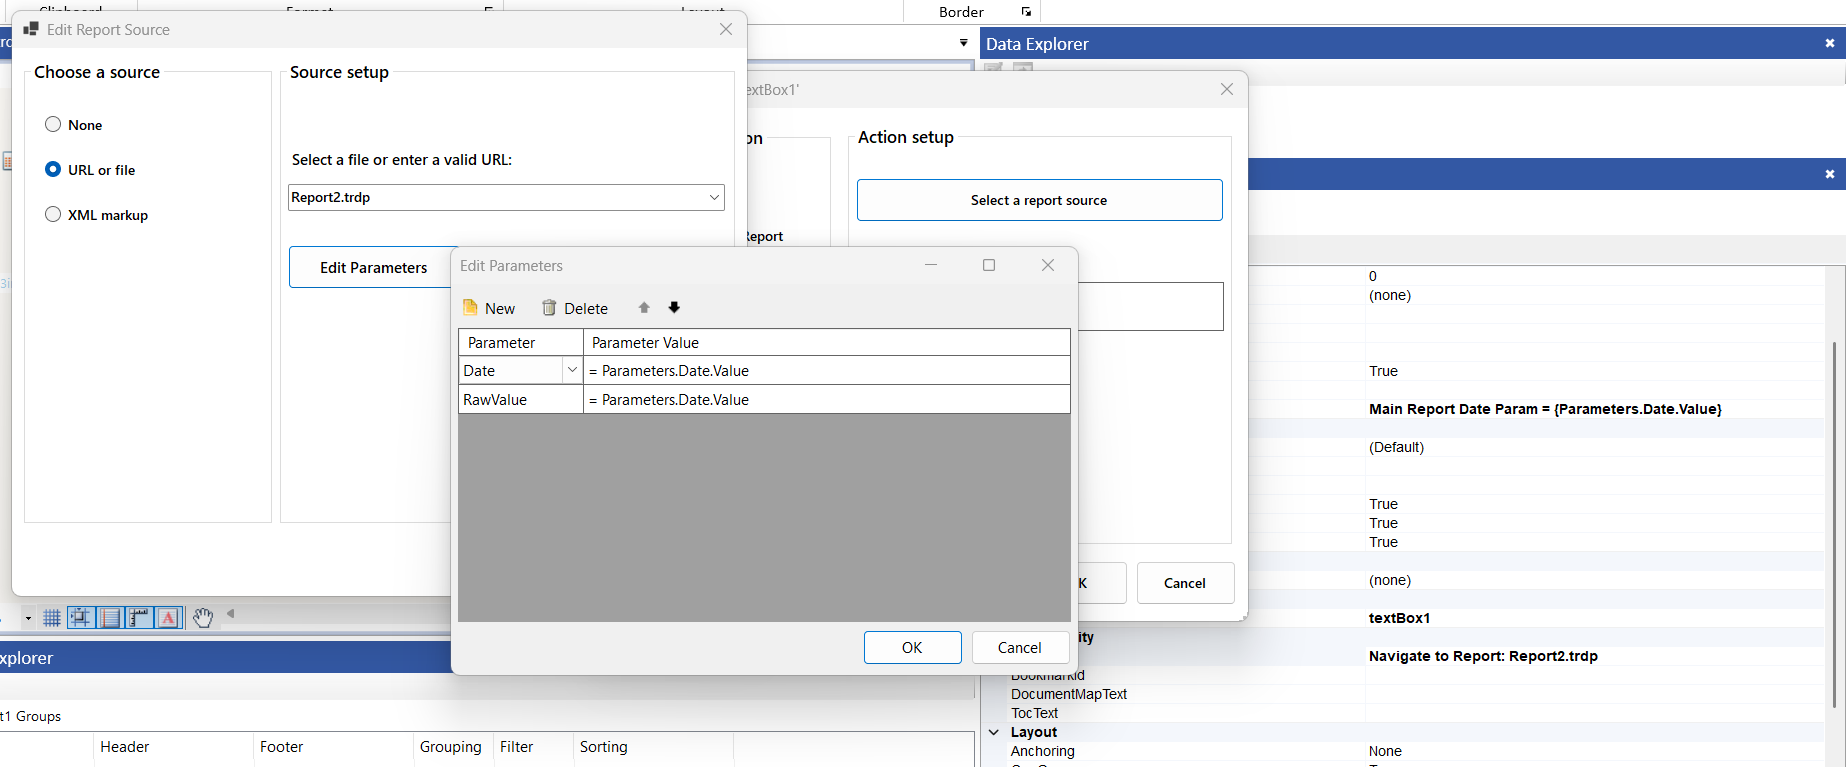
The issue seems to occur only when directly passing the value of the DateTime report parameter, so as a workaround, I decided to create a new date using the Date() function. For example:
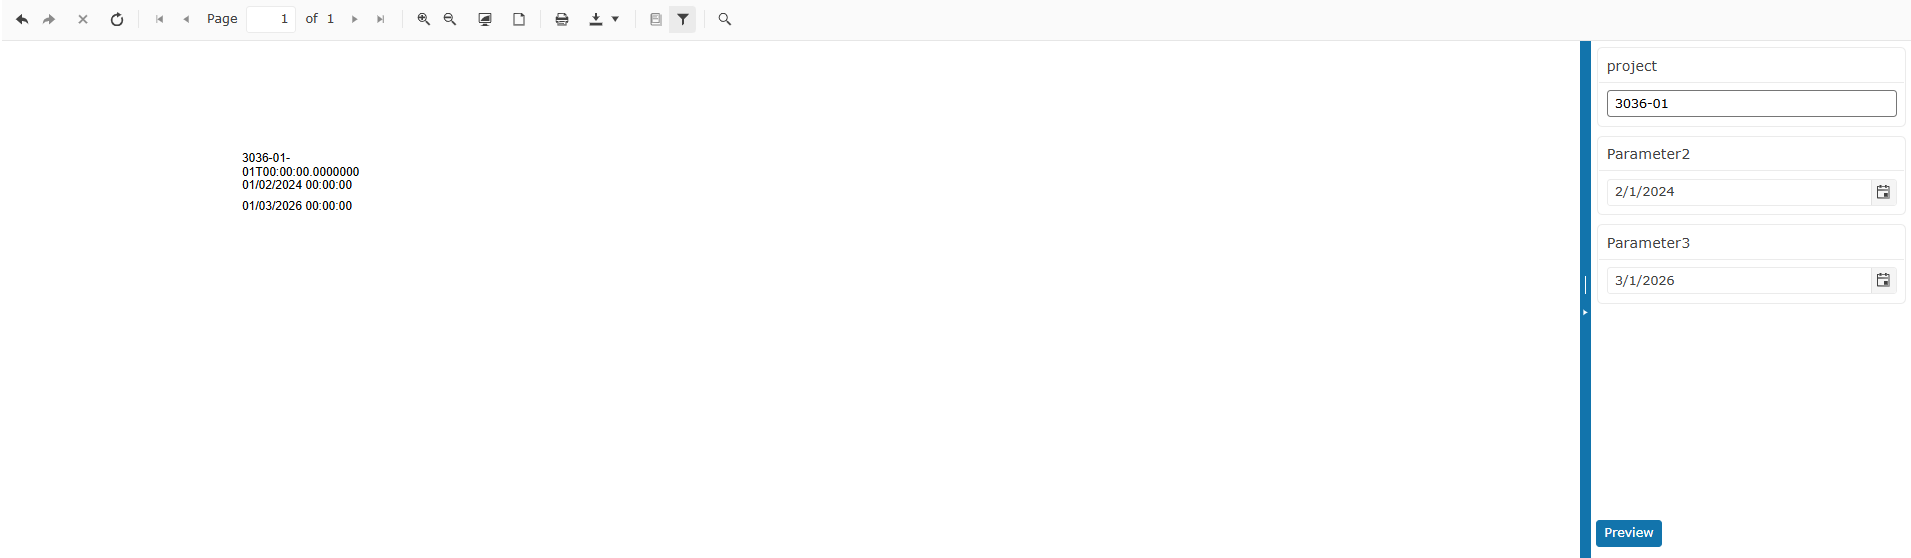
When using a report parameter of type string whose value resembles a date format (e.g., "3036-01"), the System.Text.Json serialization logic used by Telerik Reporting incorrectly treats the value as a date instead of a plain string. As a result, the parameter is serialized and displayed as a parsed DateTime value rather than the original text, leading to unexpected outputs such as "3036-01-01T00:00:00.0000000":
The provided URI should instead be only the relative URI that I have set on the action.
I have an image set to the checkbox through the CheckedImage property. When I export the report to Excel using the Skia graphics engine, the image is not present at all, or cut off.
The same issue is not present in the GDI engine or with the PictureBox item.
I have projects on .NET Core and I want to use the System.Text.Json serializer that is the new default, but reporting relies on Newtonsoft.Json.
---
ADMIN EDIT
There are two approaches that can be taken right now to solve this:
OPTION 1: define separate endpoints (services, projects) for the different tasks - they can still use the same database layer through a shared project, depending on the architecture you have. This would let you have separated services with the appropriate serializers without custom attributes and code (see below). For example, create a separate project for the reporting REST services.
OPTION 2: add some custom decoration on the endpoints so you can choose which serializer is used on each, you can find some examples here: https://stackoverflow.com/questions/59650907/how-to-configure-two-json-serializers-and-select-the-correct-one-based-on-the-ro - the point being to register a serializer depending on the endpoint based on your own code rather than let the framework put one in for all endpoints.
NOTE: This would be a breaking change.
---